OpsDeck
Free · open source · MIT

A DevOps engineer's workspace in one window

A terminal with local AI, Kubernetes, SSH and host monitoring, databases, an IDE with git, alerts, notes with tasks, KeePass and MikroTik — together, and aware of each other. Turn on only the sections you need.

Linux (.deb, .rpm, AppImage) · Windows (.msi, .exe) · macOS (.dmg, Intel and Apple Silicon)
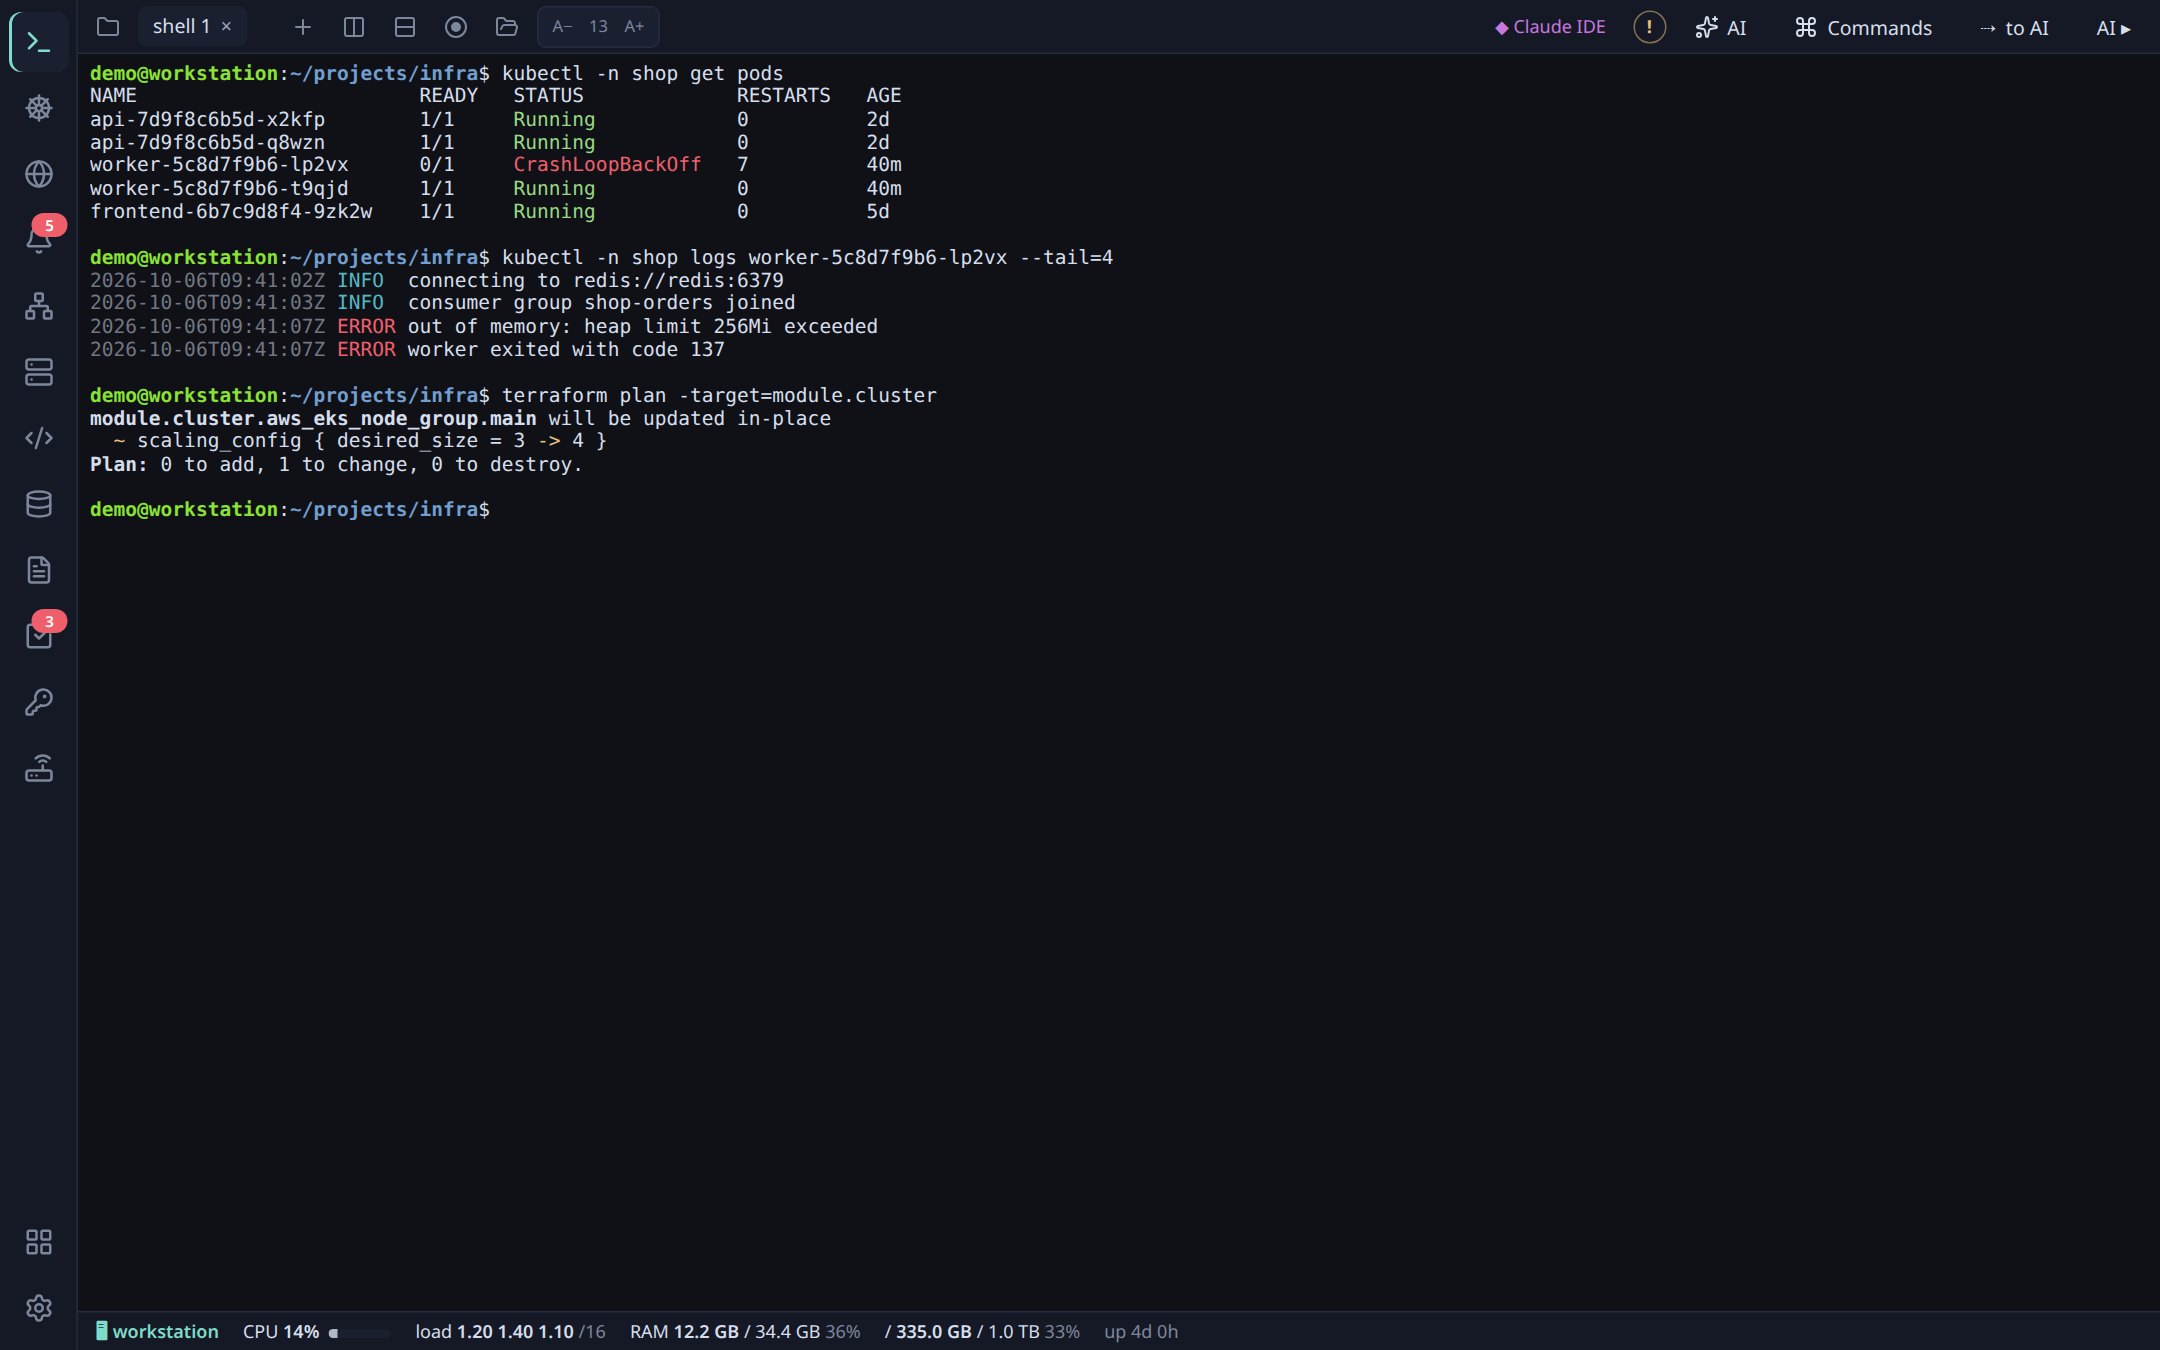
OpsDeck terminal with highlighted kubectl and terraform output

Get started

Three steps and you're working. Everything else can be set up along the way.

1

Download the installer

On the latest release page pick the file for your system:

  • Ubuntu/Debian — .deb, Fedora — .rpm, any Linux — .AppImage
  • Windows 10/11 — .msi or .exe
  • macOS — .dmg (aarch64 for M1–M4, x64 for Intel)
2

Install and run

The usual install for your system. After that OpsDeck updates itself: when a new version is out, ⚙ shows ↑.

macOS: builds are not signed with an Apple certificate. If macOS says the app is damaged, drag OpsDeck to Applications and run xattr -cr /Applications/OpsDeck.app in Terminal.

3

Turn on the modules you need

Five sections are on at first: Terminal, Kubernetes, SSH, KeePass and Notes. The ⊞ button at the bottom of the left column adds the rest.

OpsDeck finds your KeePass database and notes folder by itself if they are in your home folder. Check in ⚙ Settings.

Modules: only what you need

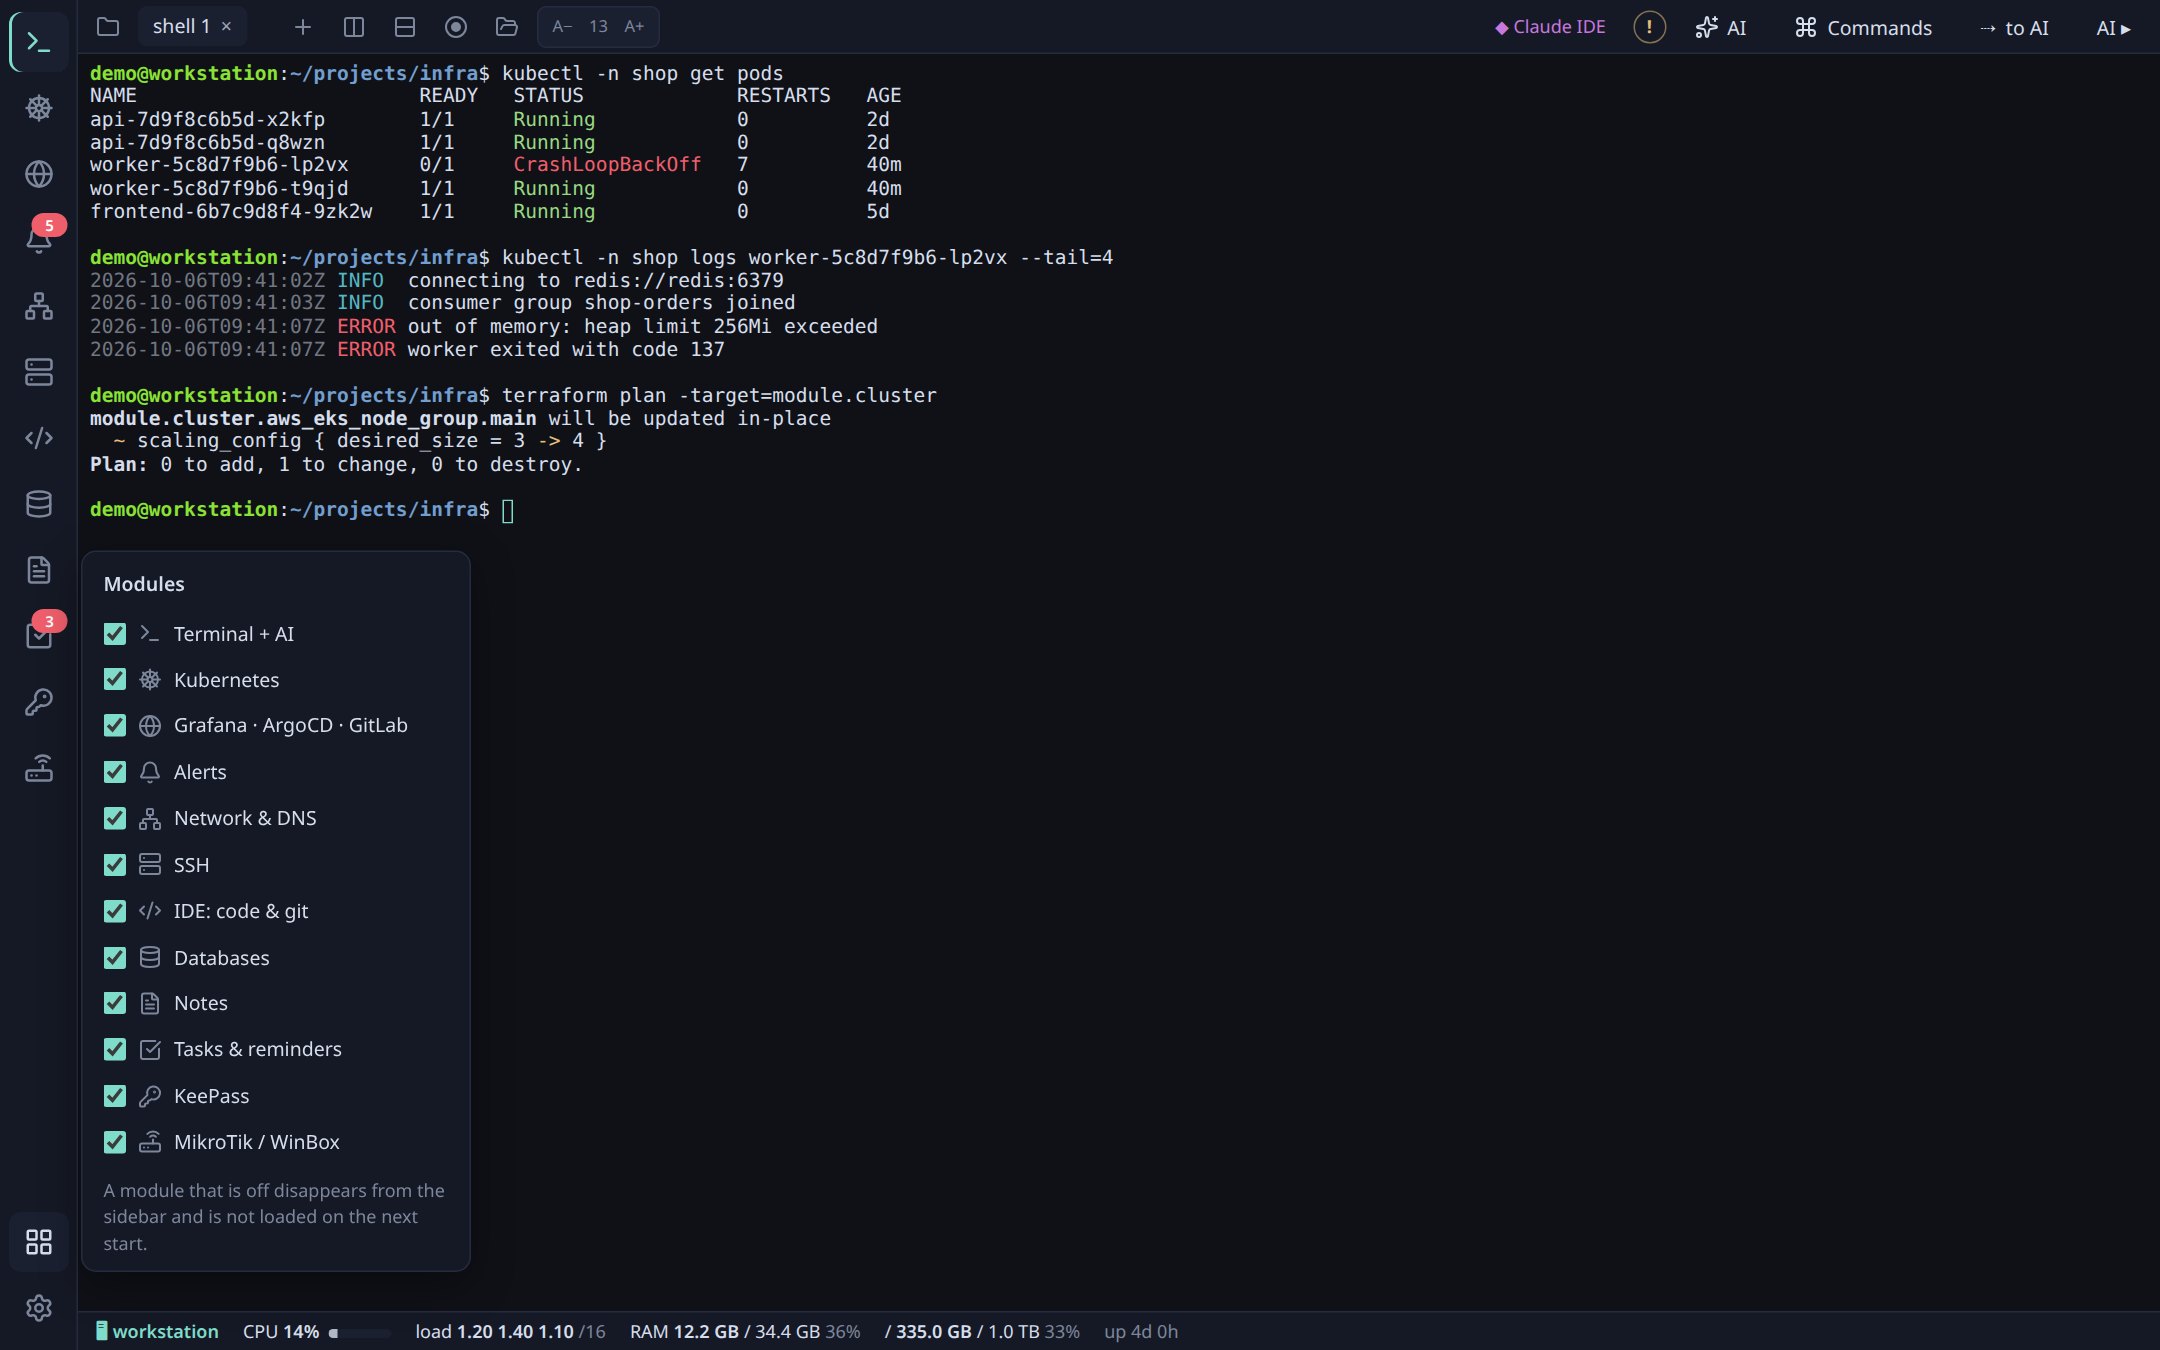
The ⊞ button at the bottom of the left column opens the list of sections with checkboxes. A section that is off disappears from the sidebar and is not loaded at startup.

  • Reorder the icons by dragging them with the mouse.
  • If another section needs one, it turns on by itself: for example, SSH opens a terminal tab even if the terminal was off.
  • If you update from an older version, all sections stay on — nothing disappears.
Modules menu with checkboxes
ModuleWhat forOn a fresh install
Terminal + AITabs and splits with bash/zsh/PowerShell/WSL, colour schemes, local AI, an AI panel with Claude Code, Codex, Gemini, Aider, OpenCode and a chat with the built-in modelon
KubernetesClusters, pods, logs, YAML, shell, port-forward, Helm, Argo CD, label filter, live node loadon
SSHYour own profiles and hosts from ~/.ssh/config, groups, jump hostson
KeePassPasswords from a .kdbx database for every sectionon
NotesObsidian-compatible Markdown vaults, tags, taskson
Grafana · ArgoCD · GitLabWeb panels in tabs with auto-logincheckbox
AlertsGrafana Alerting, Alertmanager, Zabbix and your own log analyzerscheckbox
Network & DNSping, mtr, traceroute, dig, port scancheckbox
IDE: code & gitHighlighting editor, YAML/Terraform checks, commit graph, branchescheckbox
DatabasesPostgreSQL, MySQL/MariaDB, ClickHouse, Redis, MongoDBcheckbox
Tasks & remindersTasks from notes by due date, calendar, notificationscheckbox
MikroTik / WinBoxWinBox and SSH to routers in one click, import of the router list from WinBoxcheckbox
Host monitoringA board of SSH hosts: CPU, load, RAM, disk, uptimecheckbox

What each section does

Every section has a ! button in the top right corner with a detailed in-app guide. Here is the short version.

Terminal

A real bash, zsh or PowerShell, but every command becomes a block with its exit code and duration.

  • Ctrl+Shift+T — new tab, Ctrl+Shift+D / Ctrl+Shift+E — split right / down.
  • While you type, the rest of the command is suggested in grey from history and notes: → accepts it.
  • Hover a command to copy it or its output, save it as a snippet or send it to AI. A failed command shows an “ask AI” chip.
  • Ctrl+click on a path like src/main.rs:42 opens the file at that line.
  • ⏺ records the session to a text file; the bottom bar shows CPU, RAM and disk — of this machine or of the remote one in SSH.
Settings: ⚙ → Terminal — highlighting, suggestions, font size and family (MesloLGS NF and Nerd Fonts for Powerlevel10k included), colour scheme (OpsDeck, Campbell, One Half Dark, Solarized, Dracula or your own from JSON). On Windows there is also a “Windows” block: the shell for new tabs — PowerShell 5.1/7, Git Bash, cmd or WSL, and importing schemes from Windows Terminal; the WSL button next to + opens a tab of a distribution.
Terminal with command blocks

Local AI

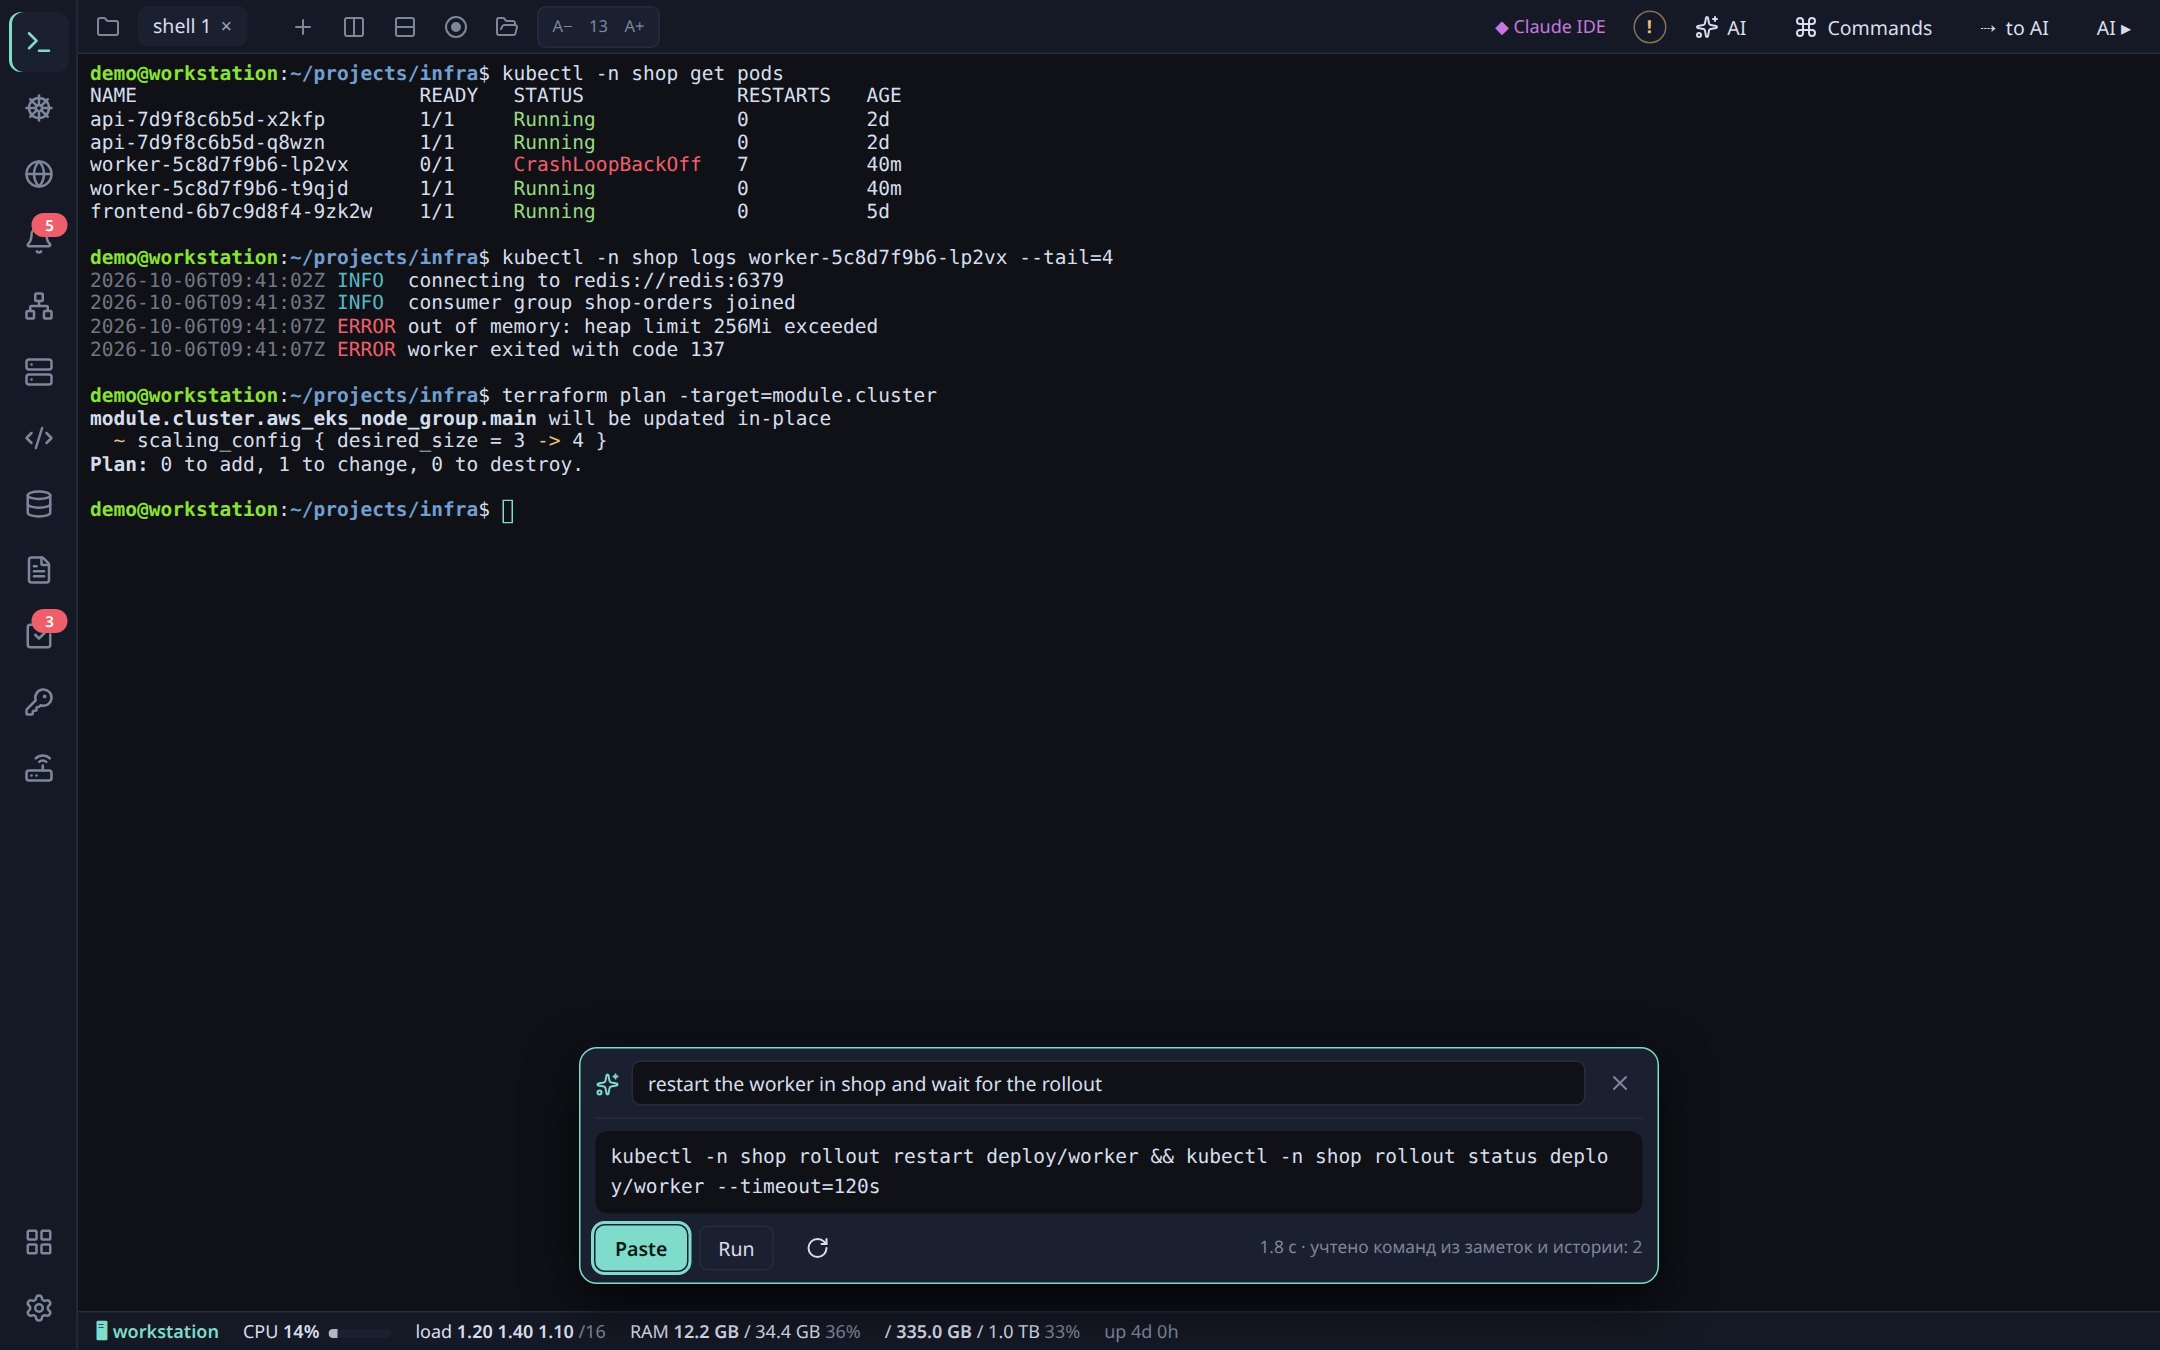
Ctrl+Shift+K in the terminal: describe in words what to do and get a ready command. Similar commands from your notes and history go along with the request, so the AI uses your namespaces and flags instead of making them up.

  • Paste (Enter) puts the command on the line without running it, Run (Ctrl+Enter) runs it.
  • The model runs only on your computer; requests go nowhere.
  • Need a bigger AI — AI ▸ on the right opens a panel with Claude Code, Codex, Gemini, Aider or OpenCode. “OpsDeck AI (local)” there is a chat with the same built-in model, see below.
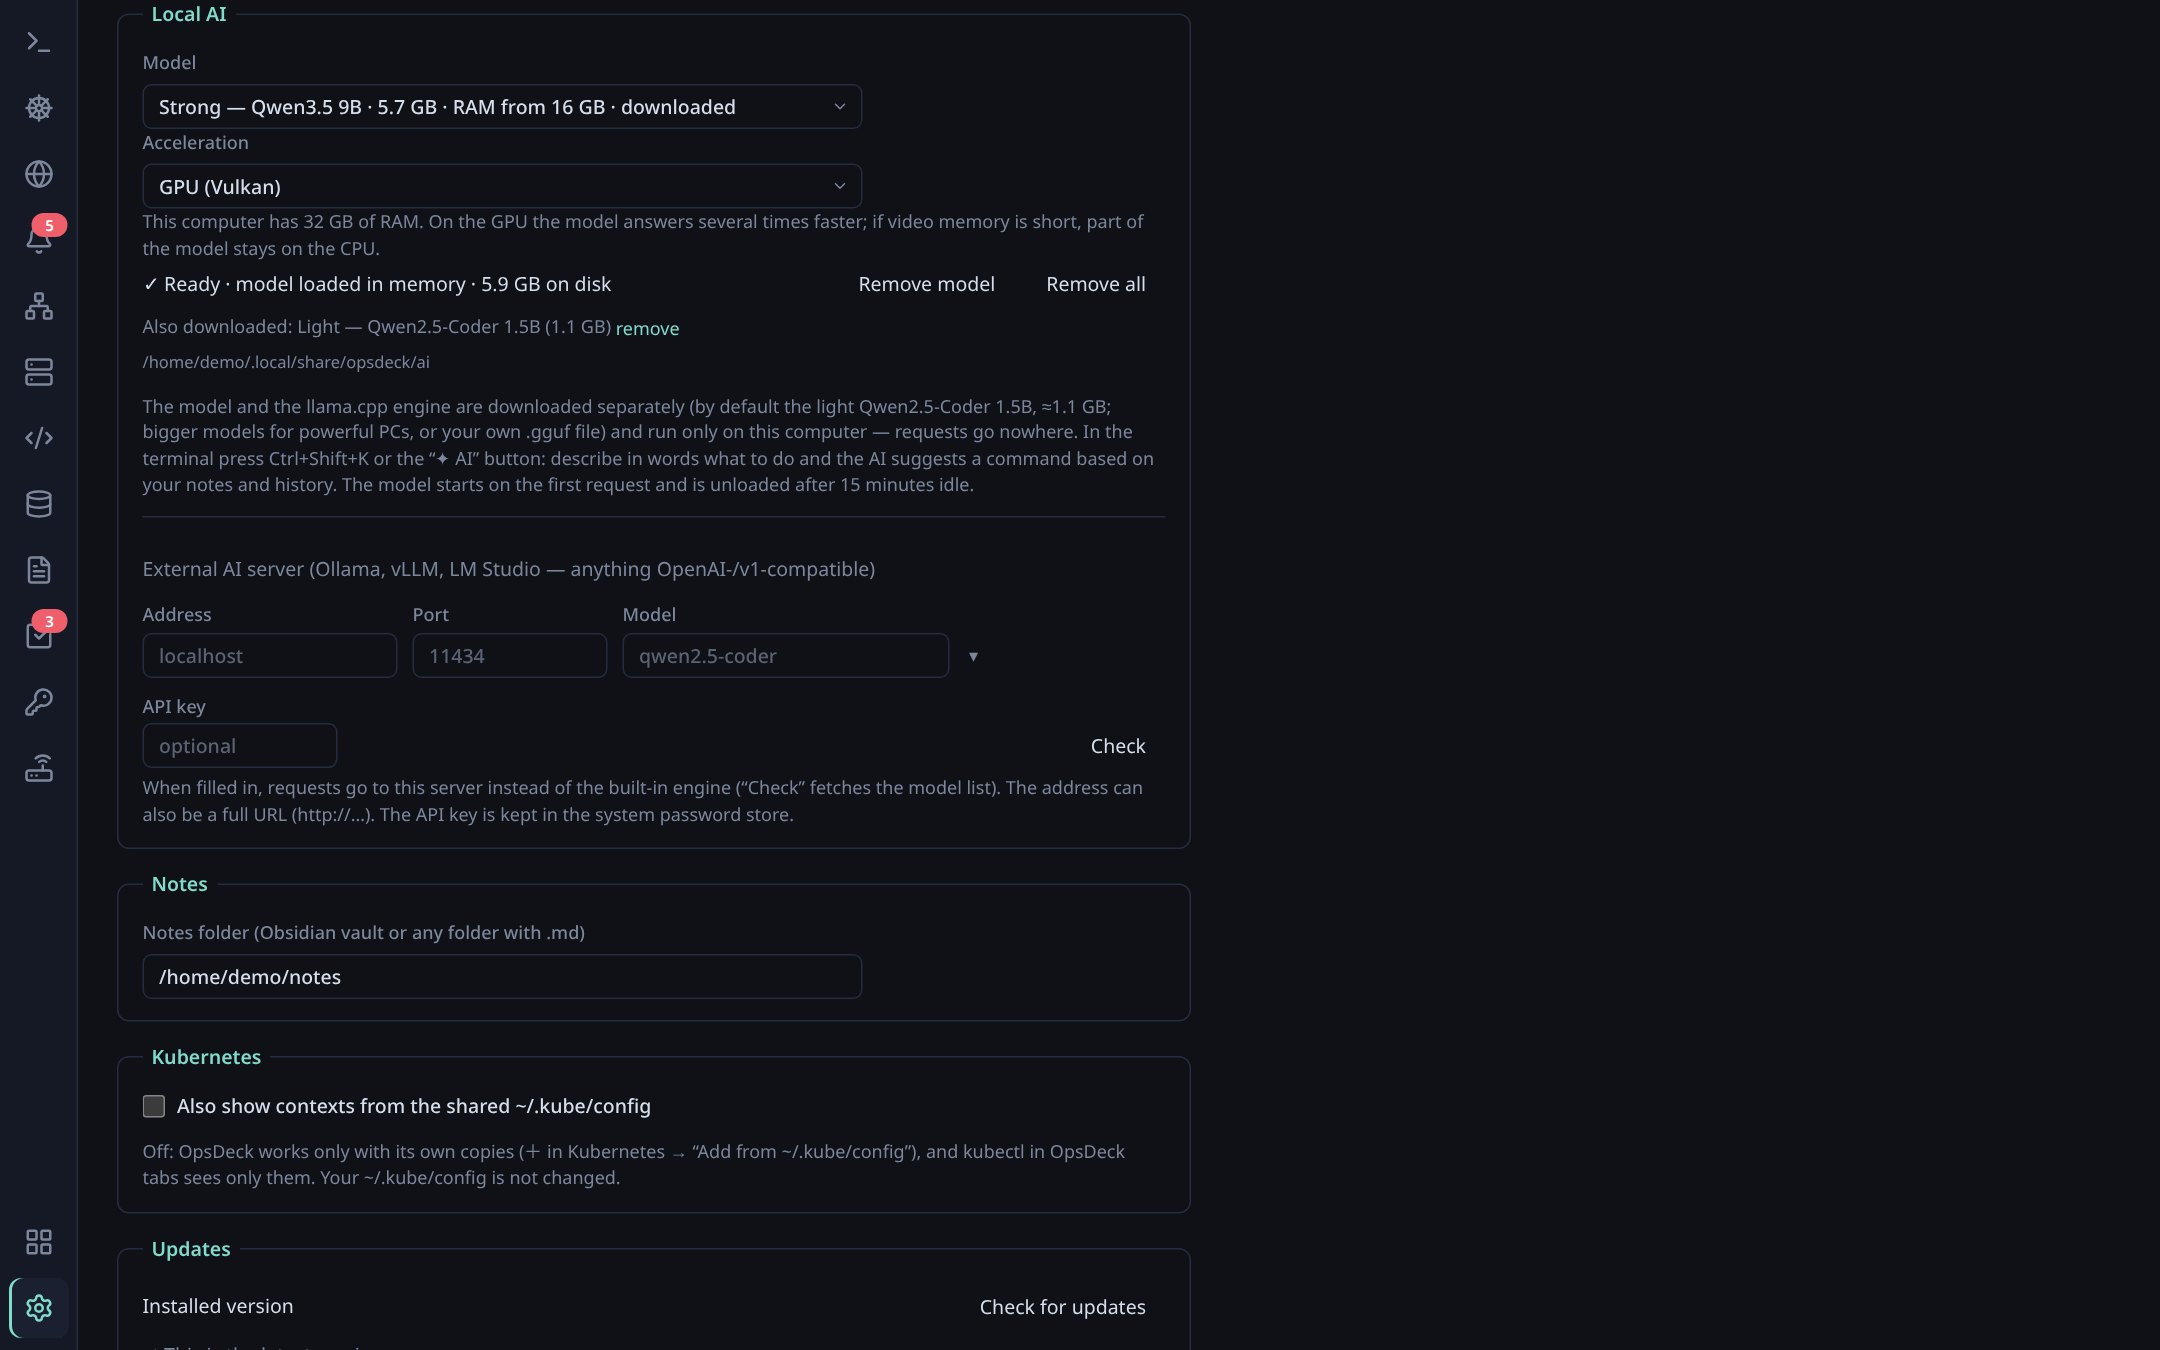
How to turn on: ⚙ → Local AI → choose a model → “Install”. Models: the light Qwen2.5-Coder 1.5B (≈1.1 GB), Qwen3.5 4B and 9B, Qwen3.6 35B-A3B or your own .gguf file. There is also “Acceleration: GPU (Vulkan)” — without a GPU the AI switches to the CPU by itself. Already run Ollama, vLLM or LM Studio? Set it in the “External AI server” block.
Local AI suggests a command from a description

Chat with the local AI

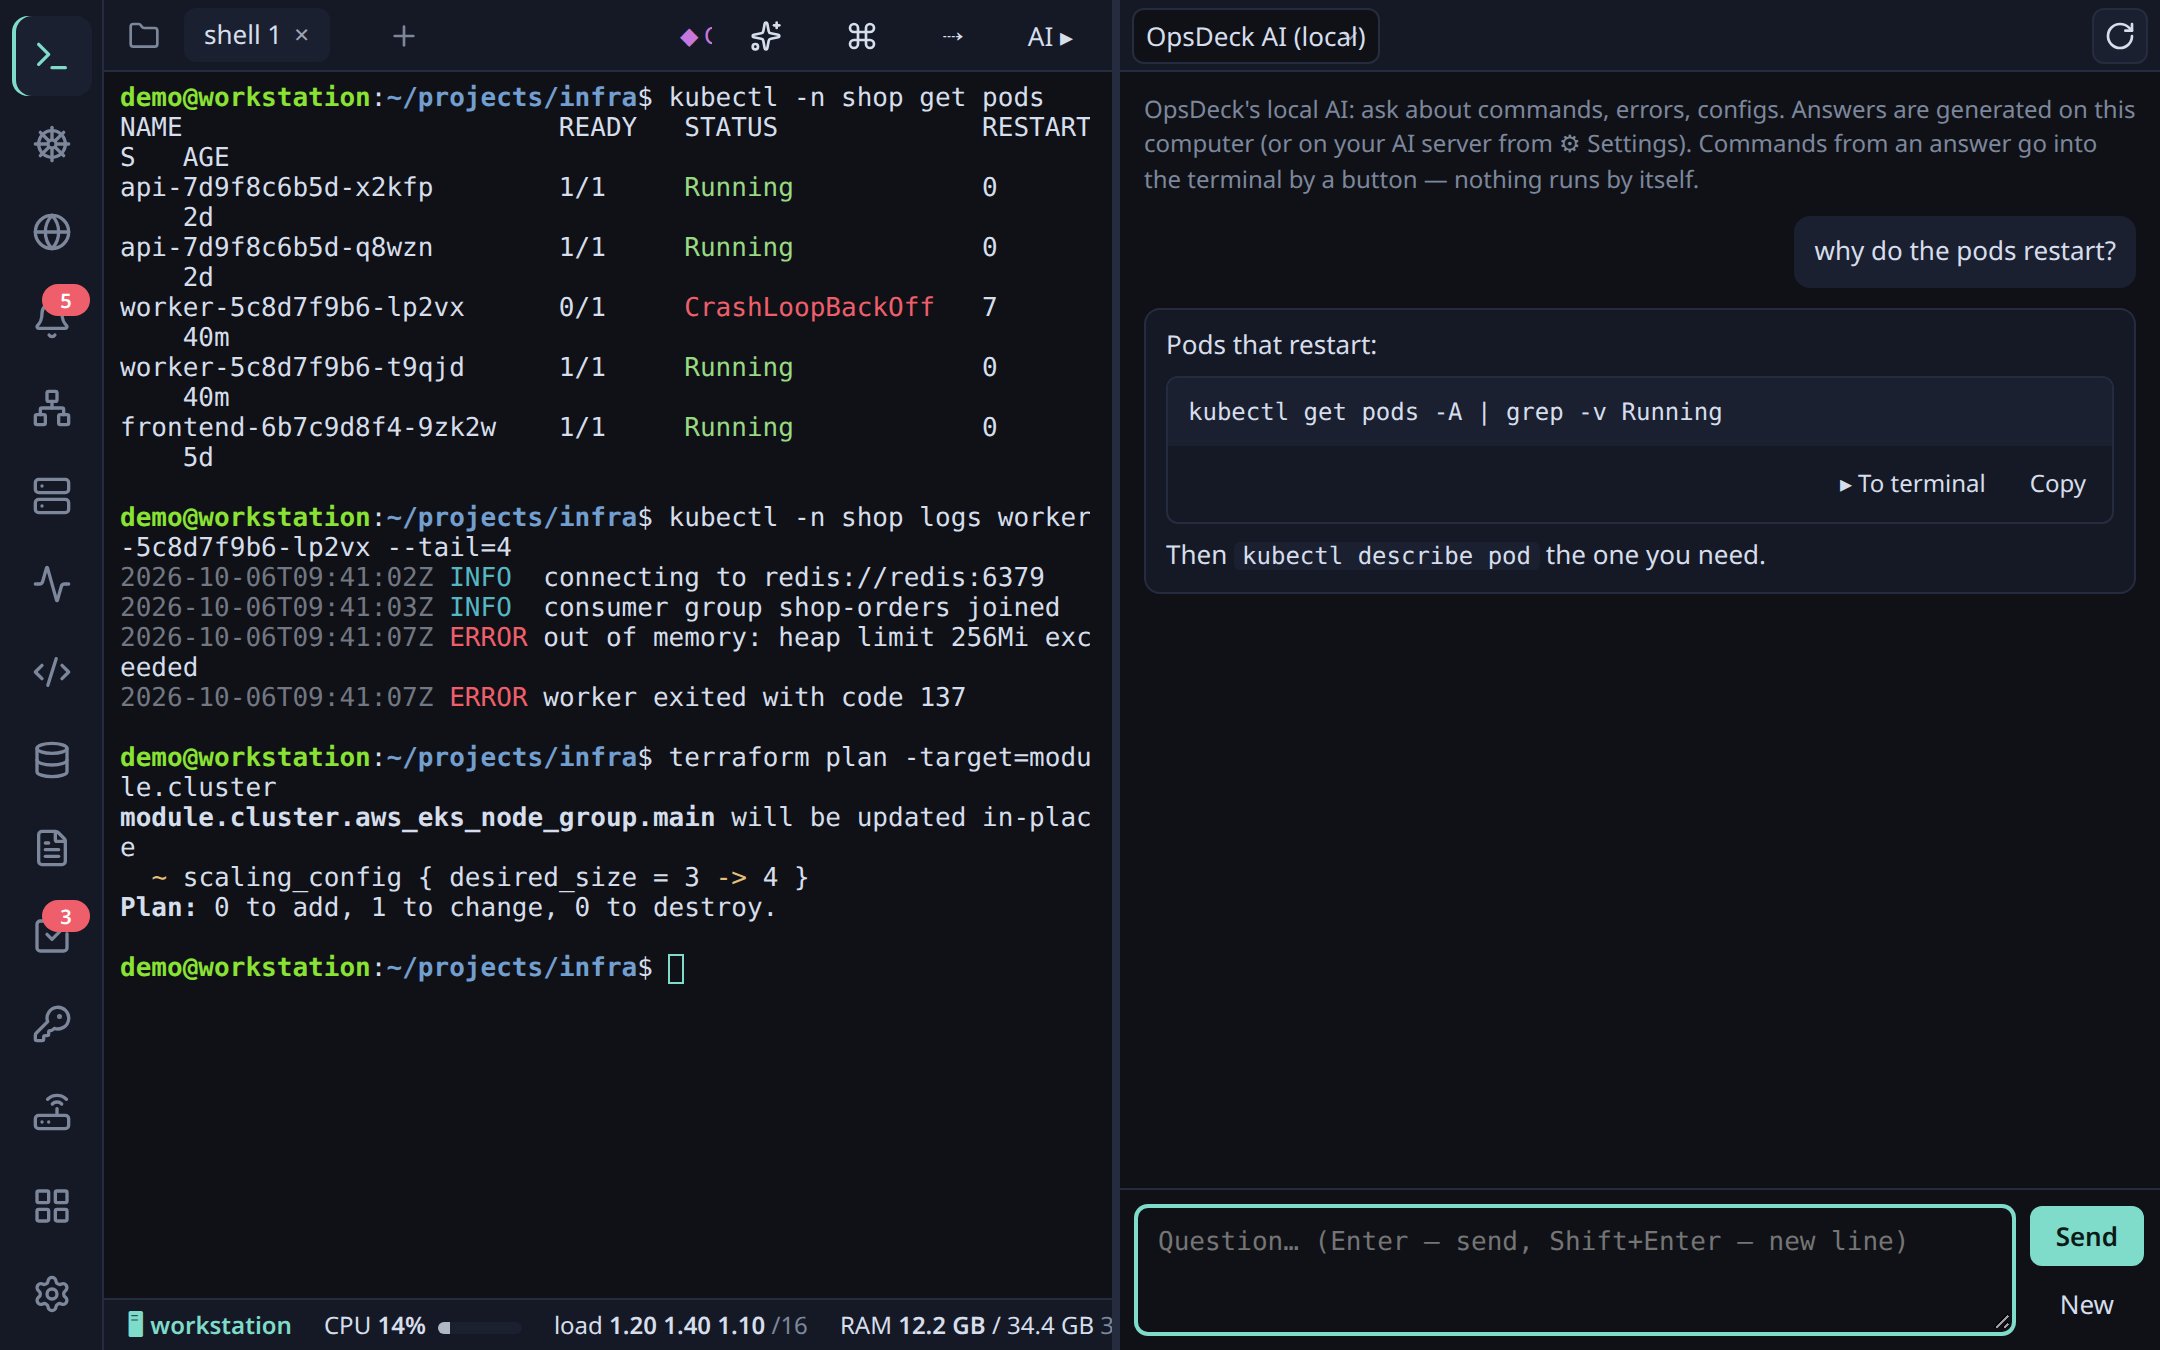
In the AI panel (AI ▸) choose “OpsDeck AI (local)” and work with the built-in model as a full assistant next to the terminal.

  • The answer is printed as it is generated, Stop ends it. The model knows the OS, the shell and the terminal's current folder.
  • Commands from an answer: ▸ To terminal inserts into the active tab without Enter — nothing runs by itself; Copy.
  • Ctrl+Shift+A, pod logs and alerts (⇢ AI) land in the question box; the “@” button in notes sends the note's text.
  • The default agent is chosen in ⚙ → AI agent — it opens in the panel and gets everything you send to AI.
Chat with the local AI next to the terminal

AI settings

  • ★ in the model list marks the biggest model that fits your computer's RAM.
  • Models are downloaded with a checksum check and can be removed one by one.
  • The model starts on the first request and is unloaded from memory after 15 minutes idle.
  • For an external server the API key is kept in the system password store. OpsDeck warns you when requests leave the computer or go unencrypted.
Local AI settings: model, acceleration, external server

Kubernetes

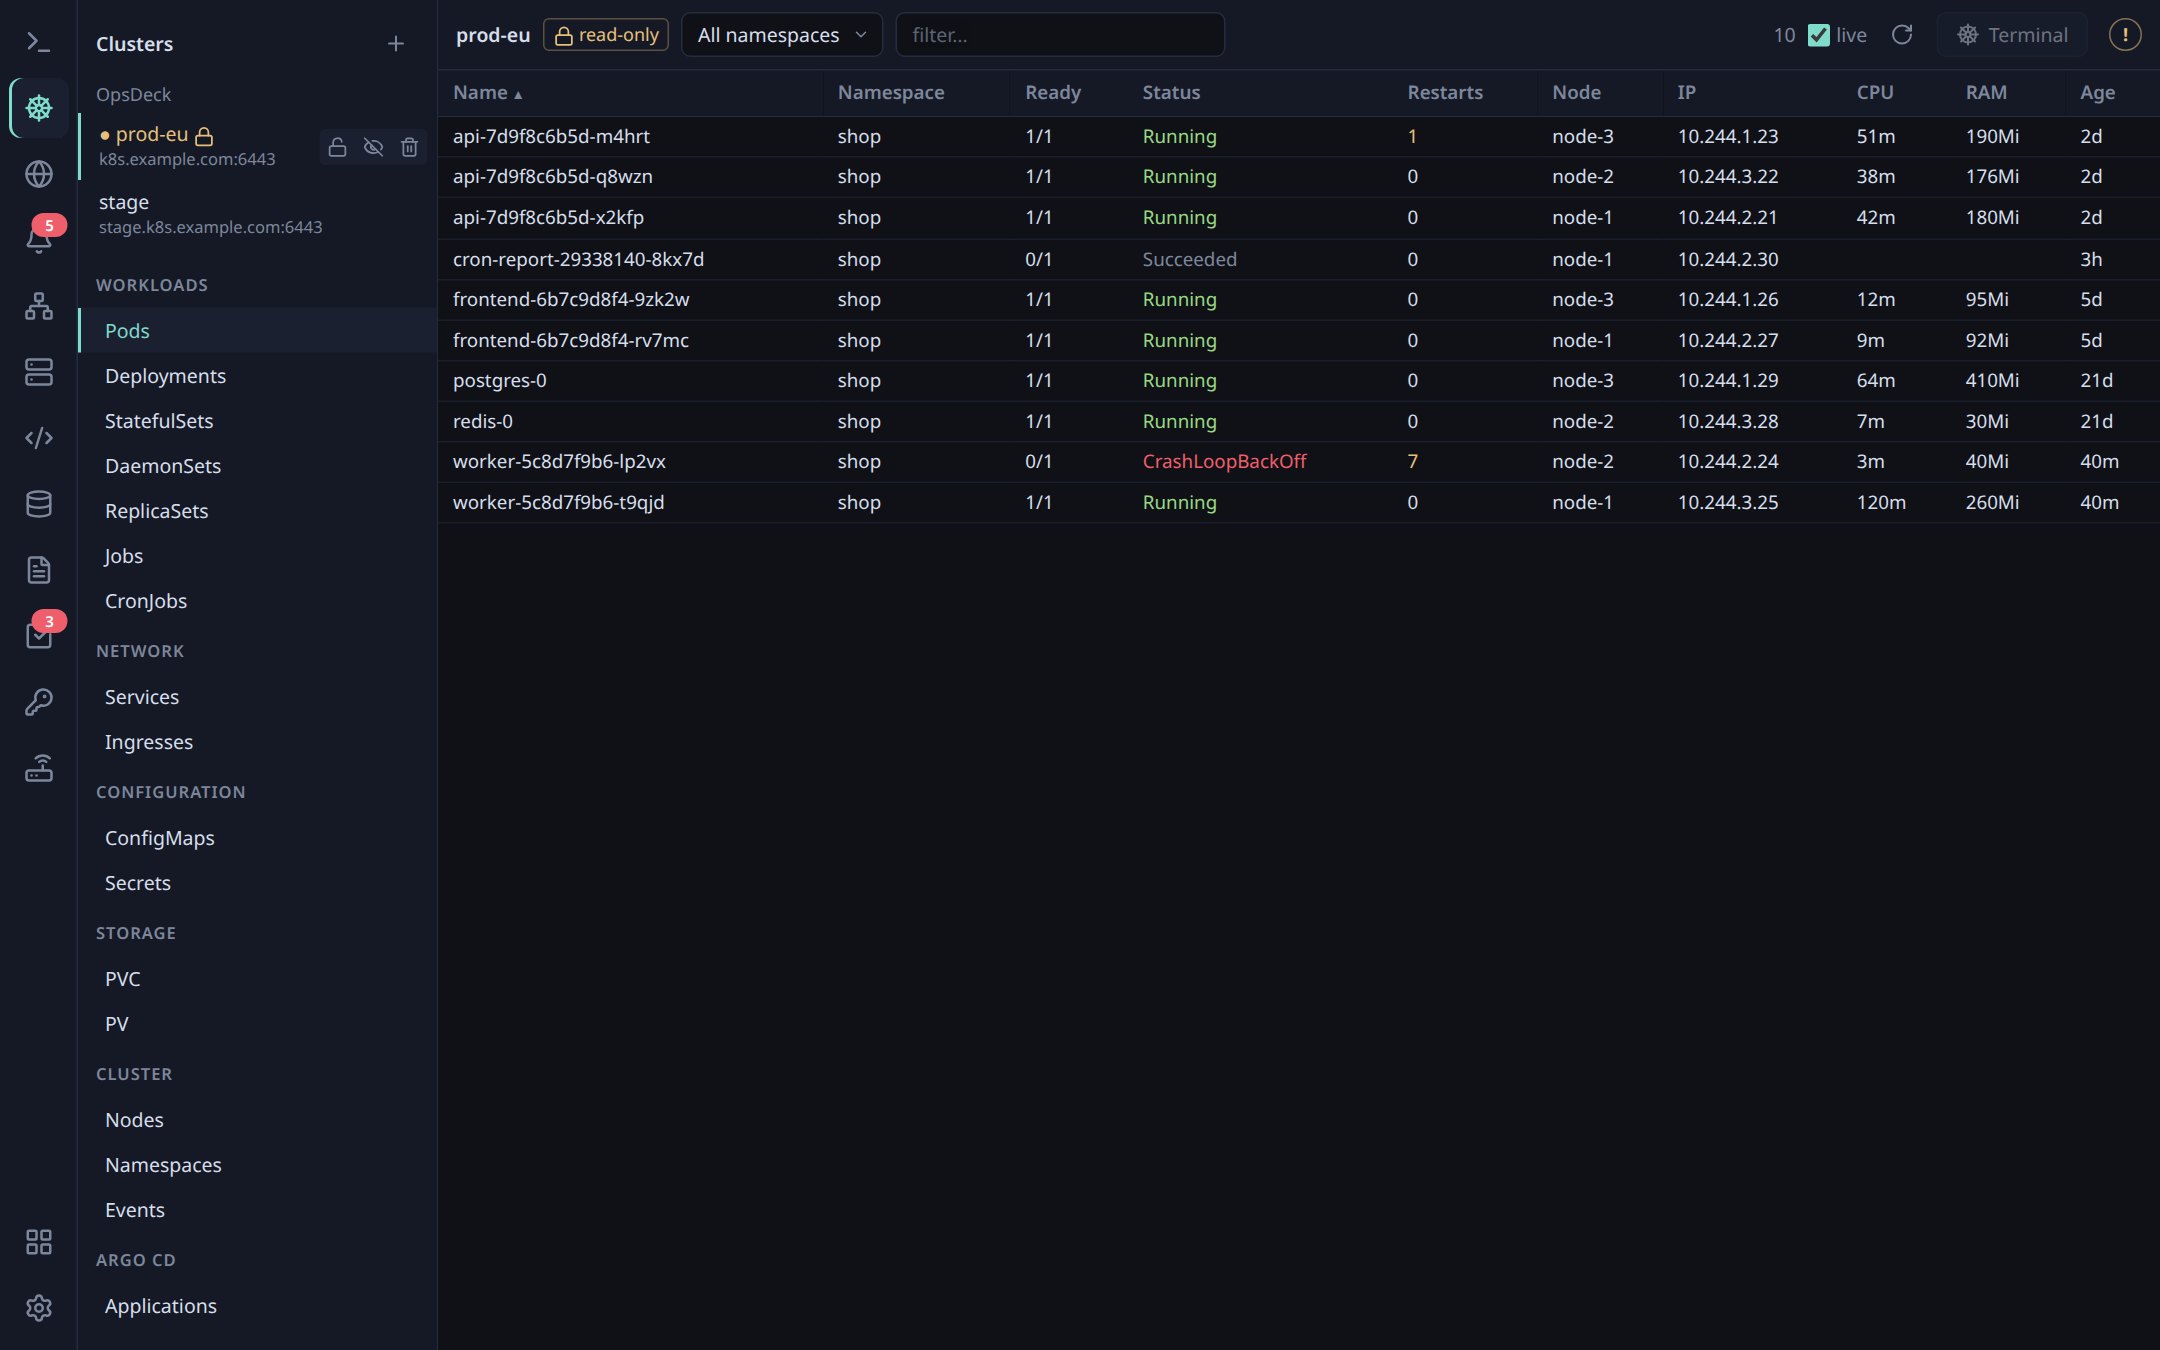
Live resource tables in the spirit of Lens: they update by themselves, with CPU and RAM from metrics-server.

  • + at the top left adds a cluster: pick contexts from ~/.kube/config, paste YAML or drop a file onto the window. Your ~/.kube/config is not changed.
  • Click a row for the bottom panel: logs (for a deployment — from all pods at once), details with links, YAML with apply.
  • Shell, port-forward, scale, restart, Helm rollback, Argo CD sync — buttons on the right.
  • 🔒 on a context makes it read-only: changes are blocked by the app itself, a stray click breaks nothing.
  • A label filter like kubectl -l: app=api, env in (prod,stage), !canary. Node CPU and RAM refresh every 5 seconds — with a usage bar and a chart.
Settings: ⚙ → Kubernetes — whether to show contexts from the shared ~/.kube/config. ⎈ Terminal in the section opens a shell with kubectl, helm and k9s in the selected context.
Pods list with CPU and RAM

Alerts

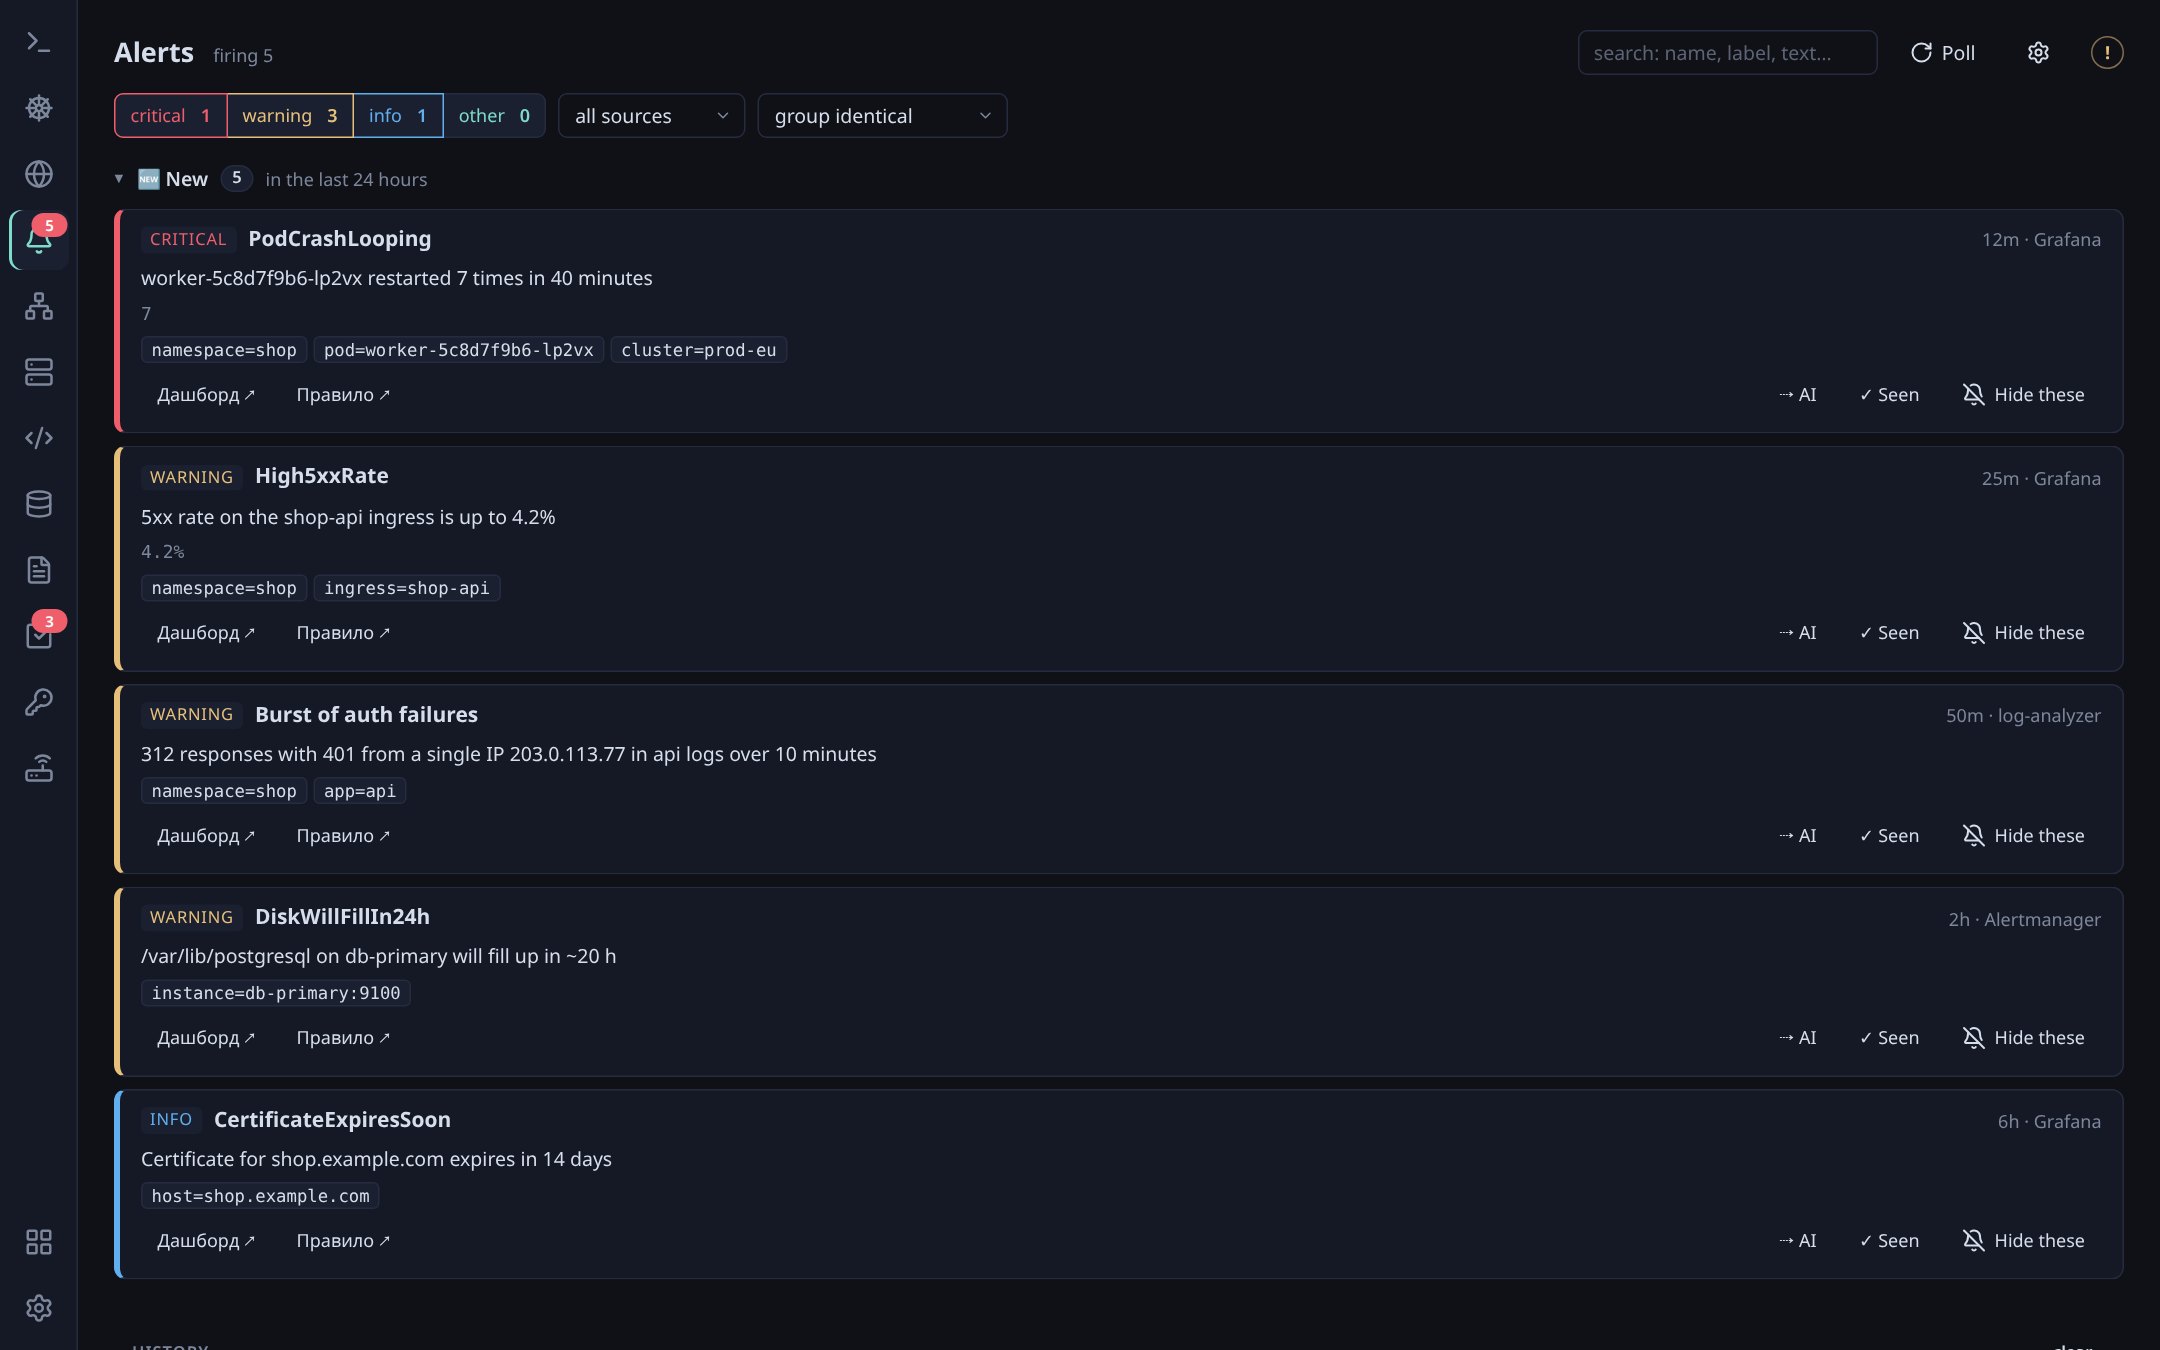
OpsDeck polls the sources itself — nothing has to reach your computer, IP and NAT don't matter.

  • Sources: Grafana Alerting, Prometheus Alertmanager, Zabbix 6.0+ (the same as its Problems page; a token or login/password, also behind HTTP Basic) and JSON feeds of your log analyzers.
  • Identical alerts are grouped into one card with a counter, sections by age. A card shows the alert itself; labels and rule details open with “Details”.
  • Card buttons: dashboard and rule in a built-in Grafana tab, → AI to analyze the alert, ✓ Seen, 🔕 Hide these.
How to turn on: the “Alerts” module in ⊞. A source is added in Grafana · ArgoCD · GitLab: + Add → type Grafana, Alertmanager or AI analyzer → “Save and test”. For Grafana a service account token with the Viewer role is enough. Poll interval — ⚙ in the alerts section.
Alert cards with actions

SSH

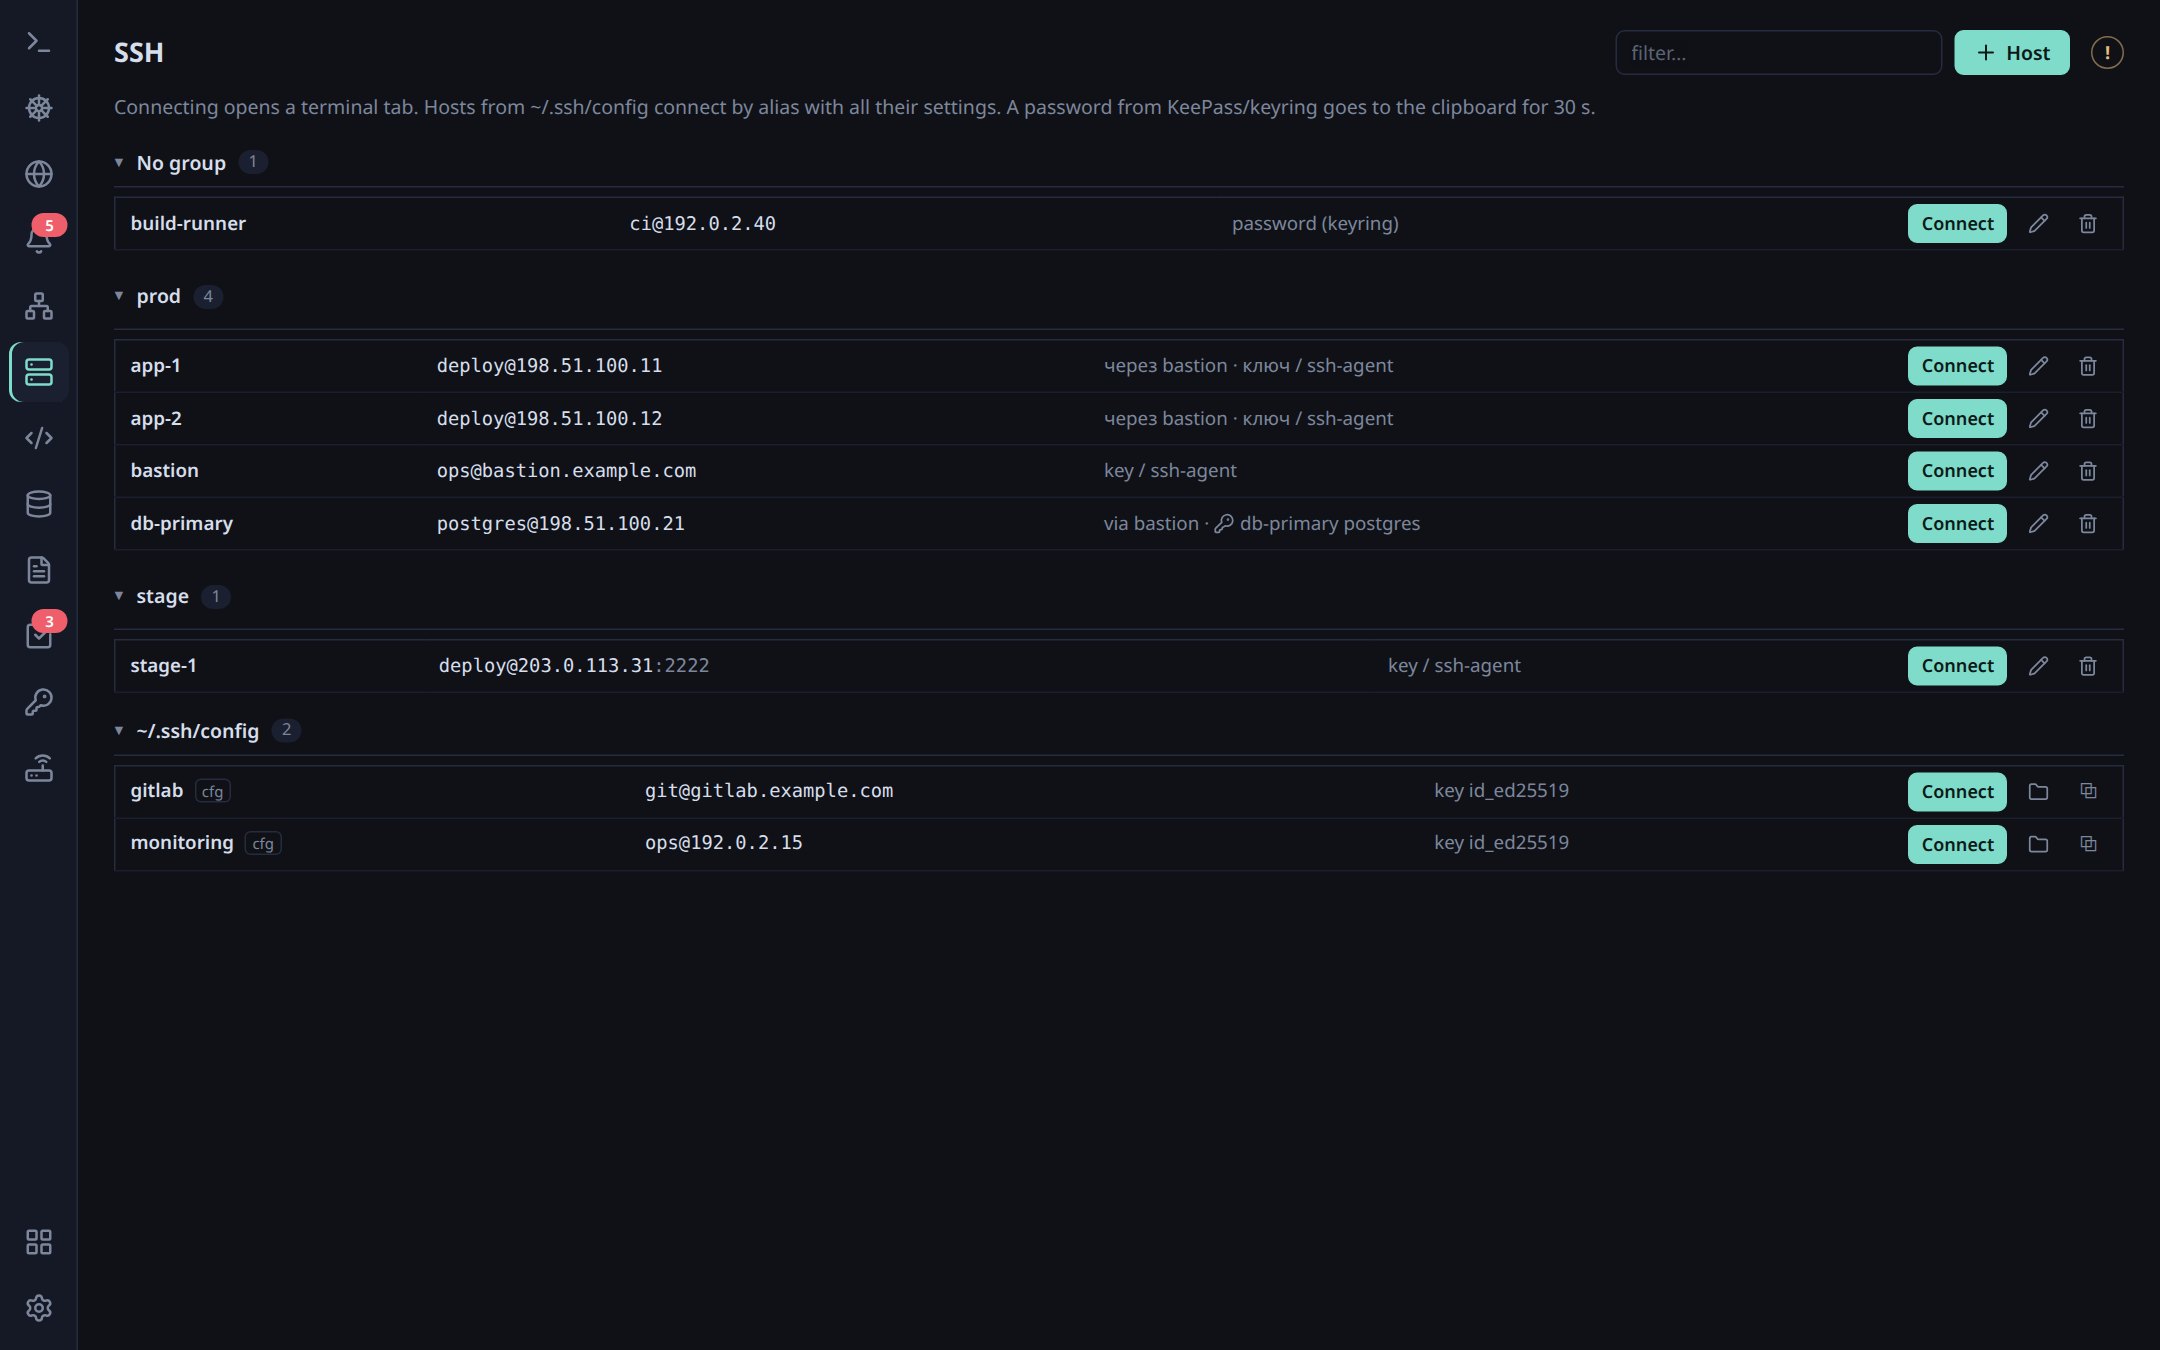
  • “Connect” opens a terminal tab. Hosts from ~/.ssh/config work with all their settings, ProxyJump included.
  • + Host — your own profile: address, port, user, key, jump host, password from KeePass or the keyring.
  • Drag hosts into groups with the mouse — onto a group header or into “+ New group”.
  • The password goes to the clipboard for 30 seconds — paste it with Ctrl+Shift+V when ssh asks.
SSH hosts in groups

Host monitoring

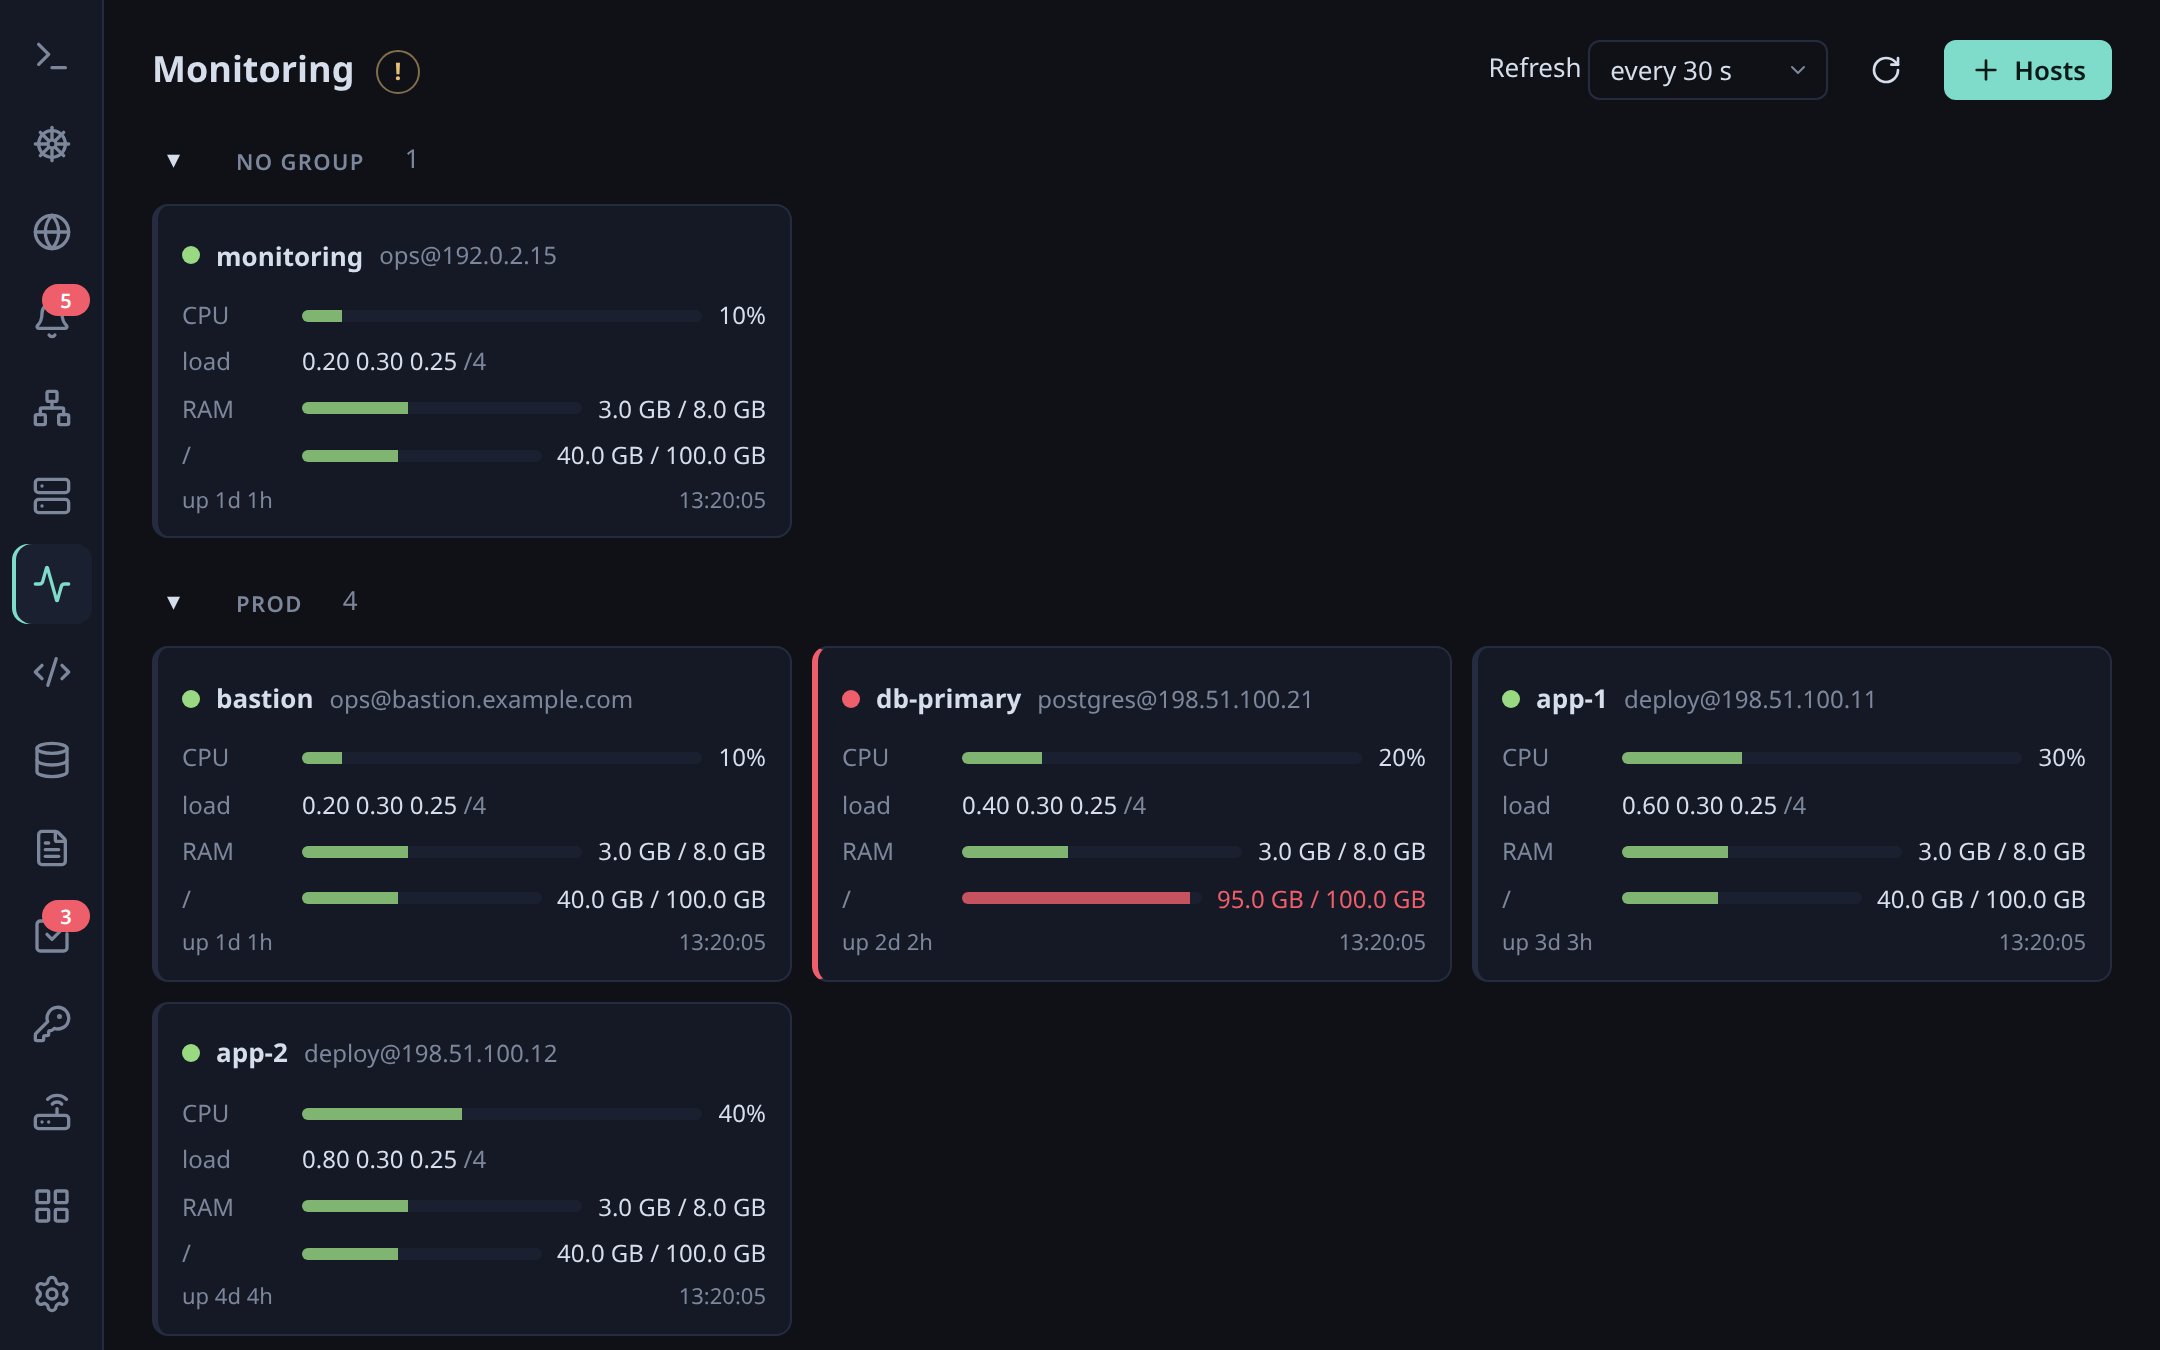
A board of SSH host cards: CPU, load, memory, disk and uptime. The card colour follows the worst value: yellow from 75%, red from 90%.

  • + Hosts — profiles from the SSH section and hosts from ~/.ssh/config; groups become sections of the board.
  • Metrics are read over ssh with a key or over a session already open — the board never asks for a password. The connection is reused, so polling is cheap.
  • Groups fold (a summary by colour stays, hosts are not polled), × takes a host or a group off the board.
How to turn on: the “Host monitoring” module in ⊞. The poll interval is at the top of the section.
Monitoring board of SSH hosts

IDE: code & git

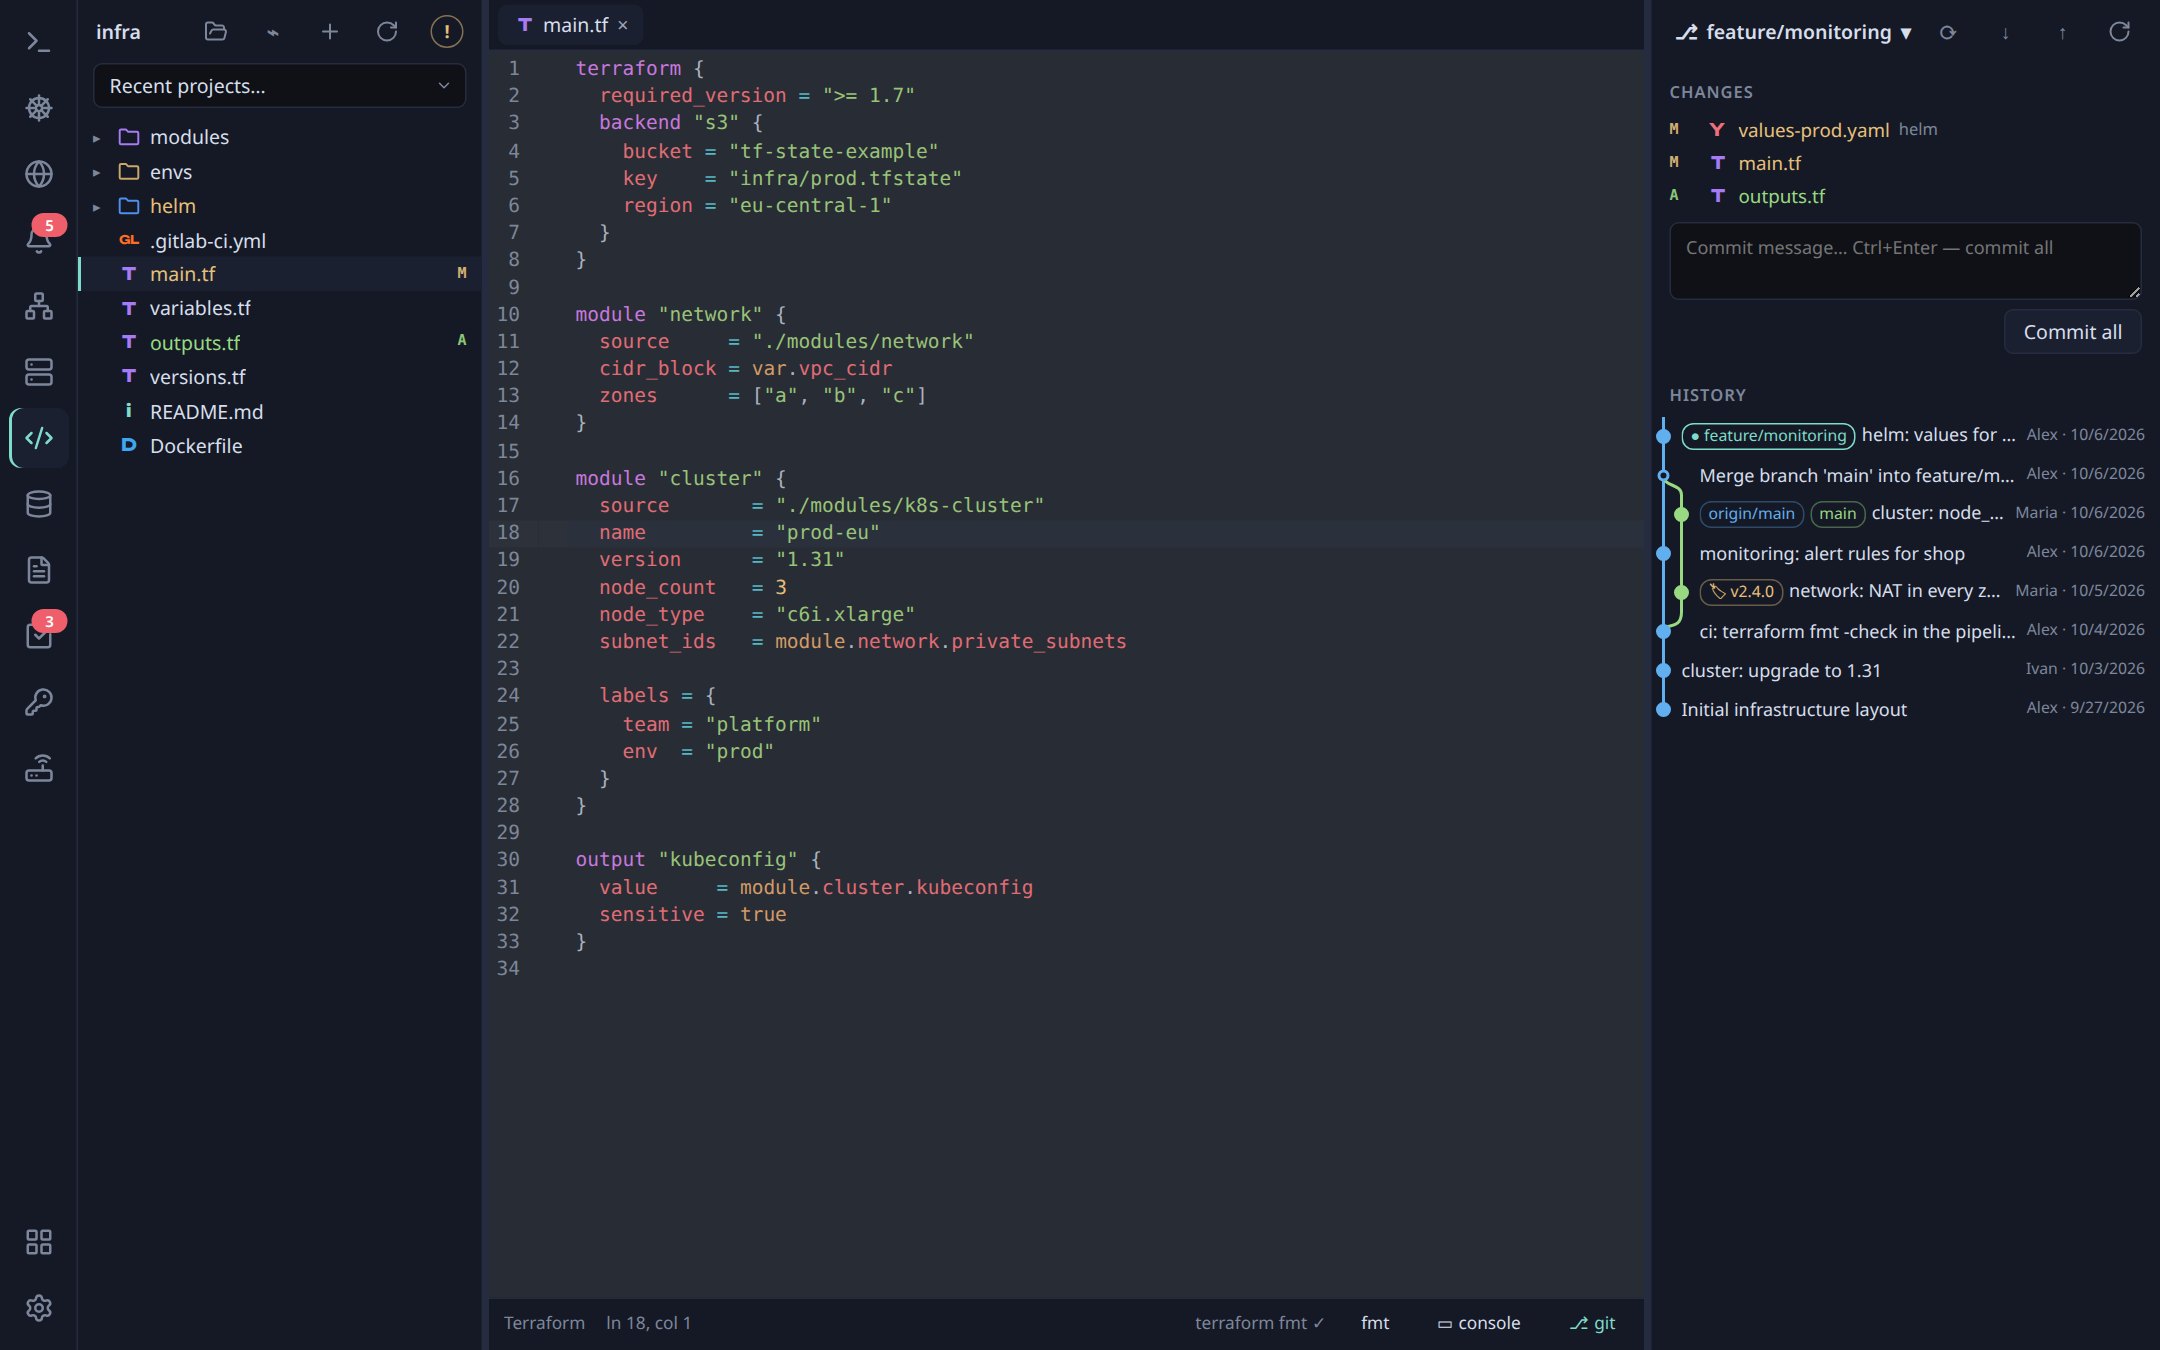
  • 📂 opens a project folder; the tree on the left colors git changes.
  • Highlighting for Terraform, YAML, JSON, Go, Python, Rust, SQL, Dockerfile and more. YAML and Terraform errors are underlined right away, .tf is formatted like terraform fmt on save.
  • ⎇ git at the bottom right — changes, commit, a graph of all branches, switching and creating branches, fetch/pull/push. Switched the branch in a terminal — the graph updates by itself.
  • ▭ console (Ctrl+`) — a terminal right in the project folder.
How to turn on: the “IDE: code & git” module in ⊞. To open files from the terminal here, choose “OpsDeck IDE” in the terminal's 📁 Files panel.
Terraform editor and git panel

Databases

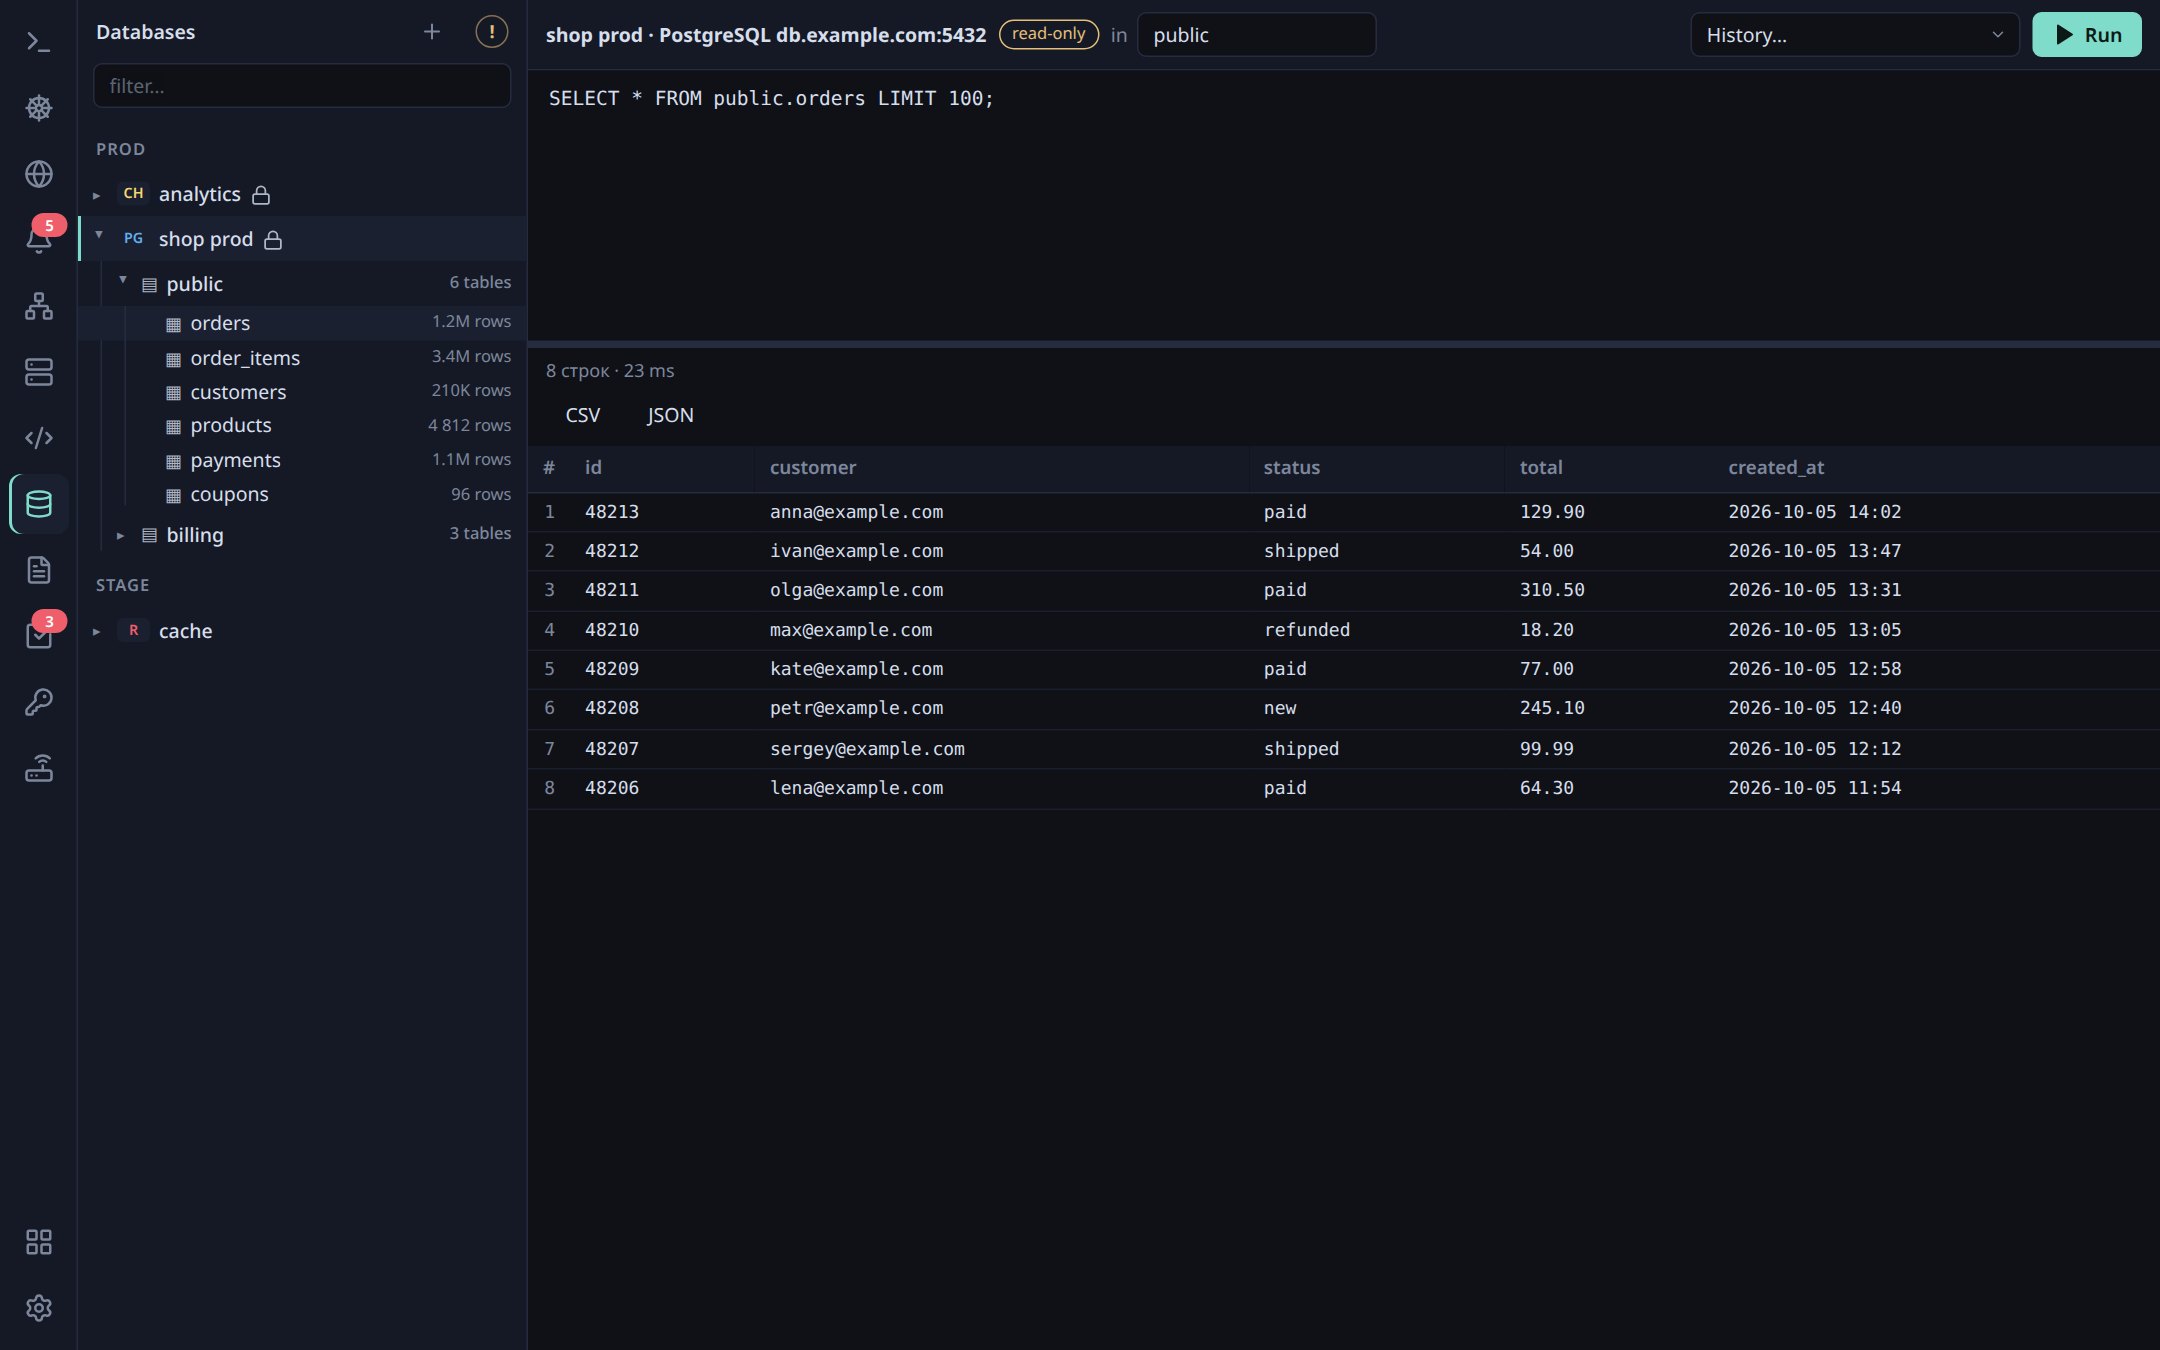
  • PostgreSQL, MySQL/MariaDB, ClickHouse, Redis and MongoDB. + — new connection; “Save and test” shows the server version or the error right away.
  • The database structure is on the left, double-click a table for its first rows. Ctrl+Enter runs the query.
  • Copy results as CSV or JSON; history keeps the last 50 queries.
  • A “read-only” checkbox for production: PostgreSQL and ClickHouse forbid writes on the server side.
How to turn on: the “Databases” module in ⊞. The password is kept in the system keyring or taken from a KeePass entry.
Database structure and query result

Notes

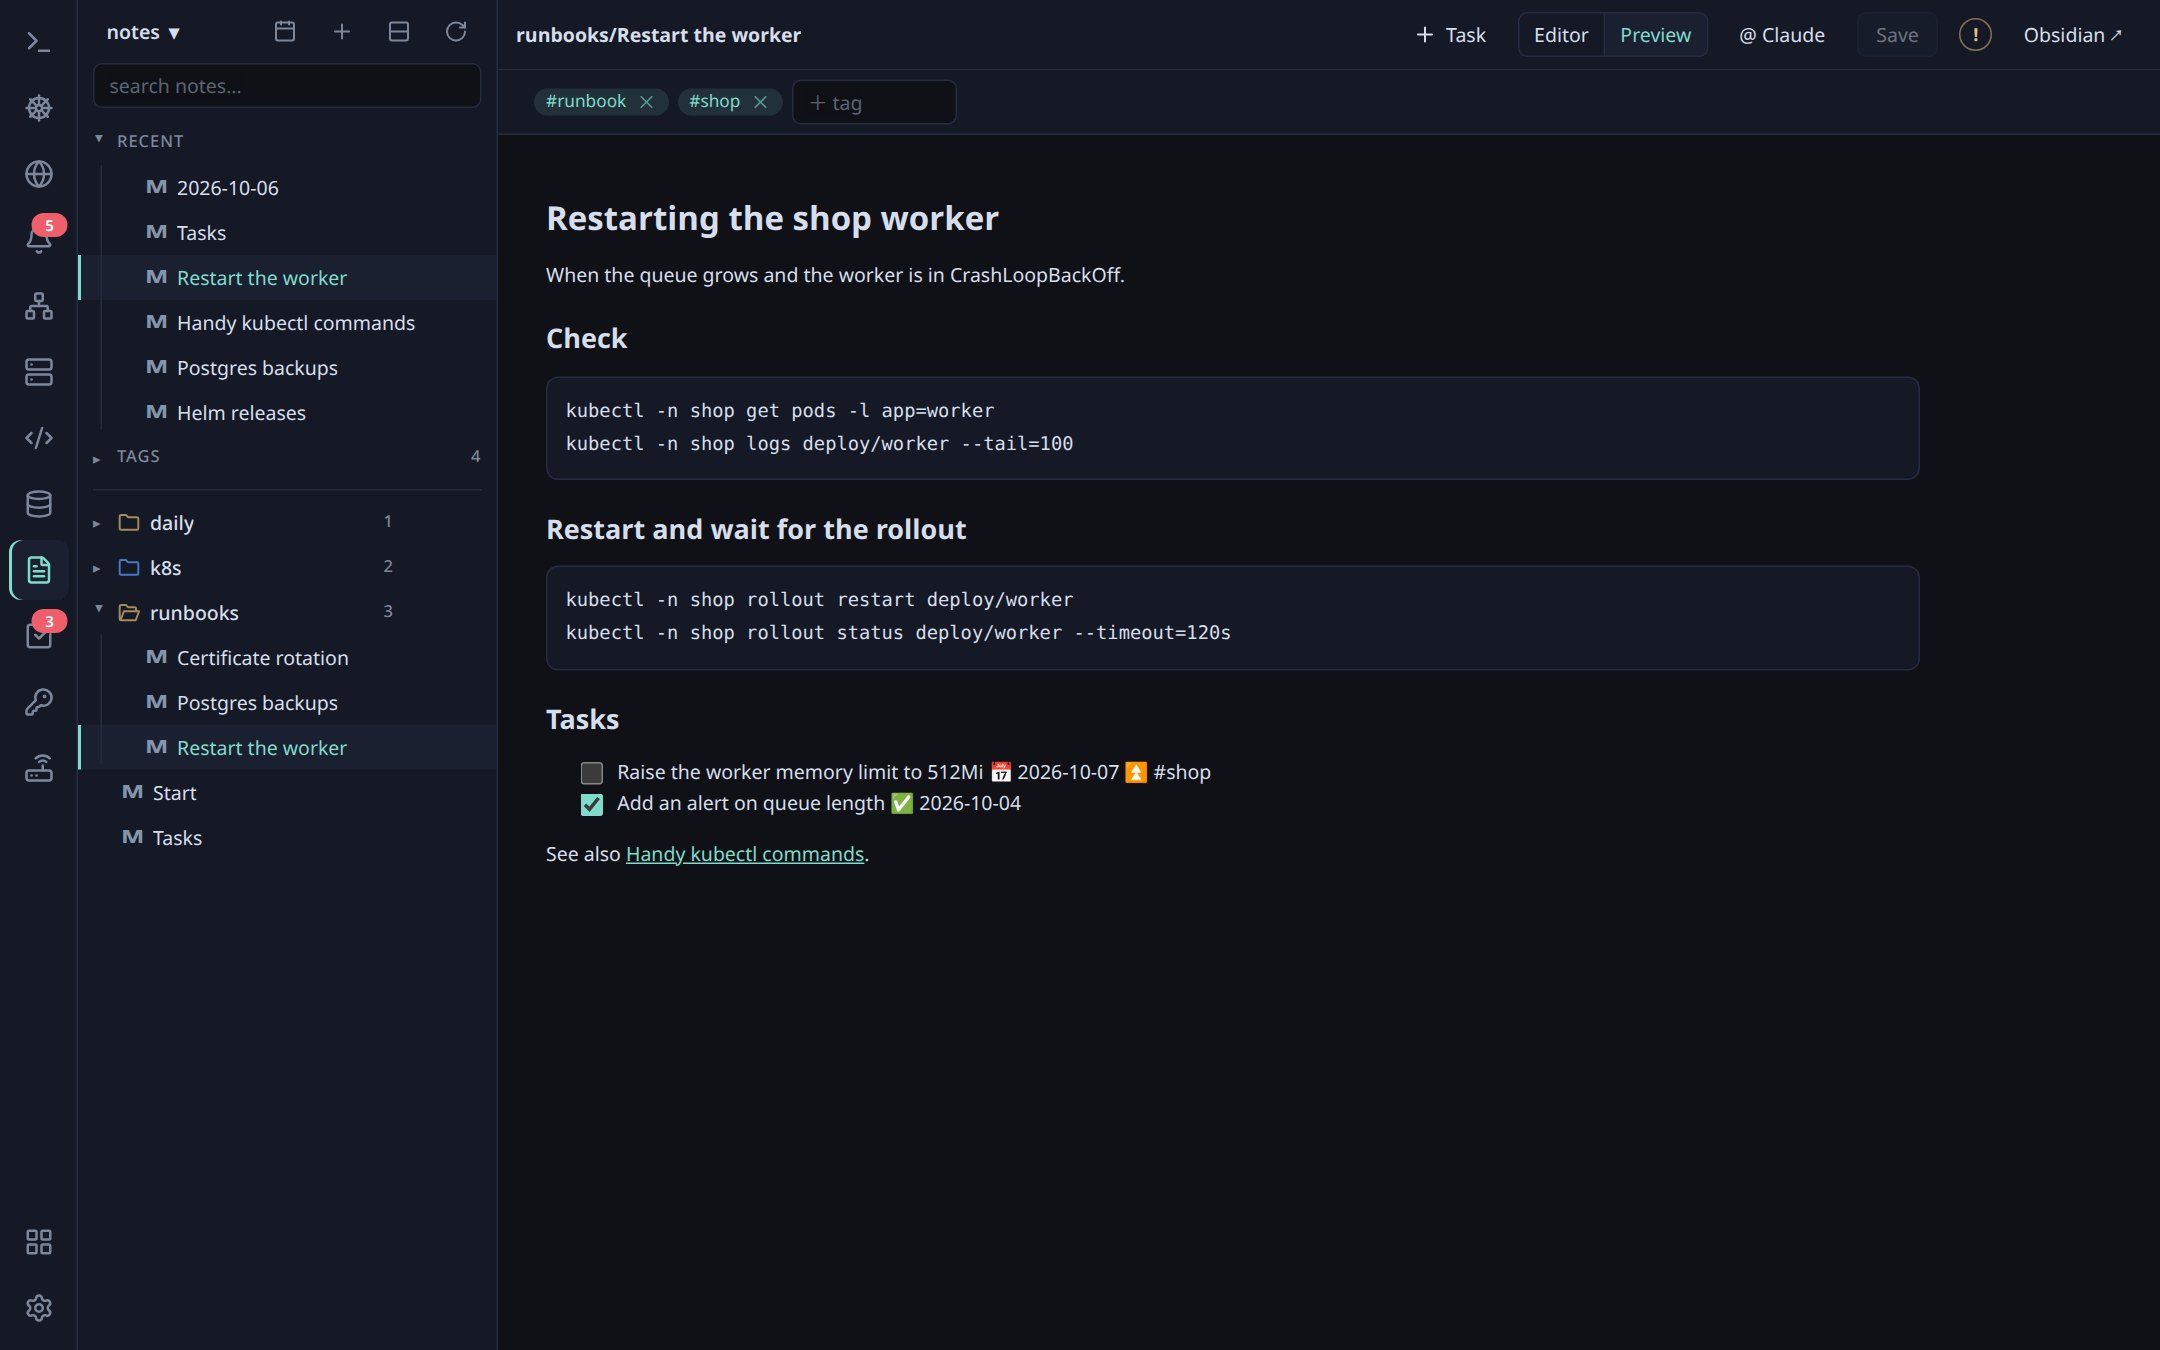
  • Plain .md files in a folder, compatible with Obsidian. You can have several vaults — switch with the vault name button at the top left.
  • Add tags with the “+ tag” field and its suggestions; drag notes and folders with the mouse; deleted notes go to the vault's trash.
  • Commands from code blocks in your notes are suggested in the terminal and help the local AI.
  • + Task inserts a task in the Obsidian Tasks format: due date, reminder time, priority, tags.
Settings: ⚙ → Notes — the vault folder. Create a new vault or open a folder from the vault name menu.
A runbook note with commands and tasks

Tasks & reminders

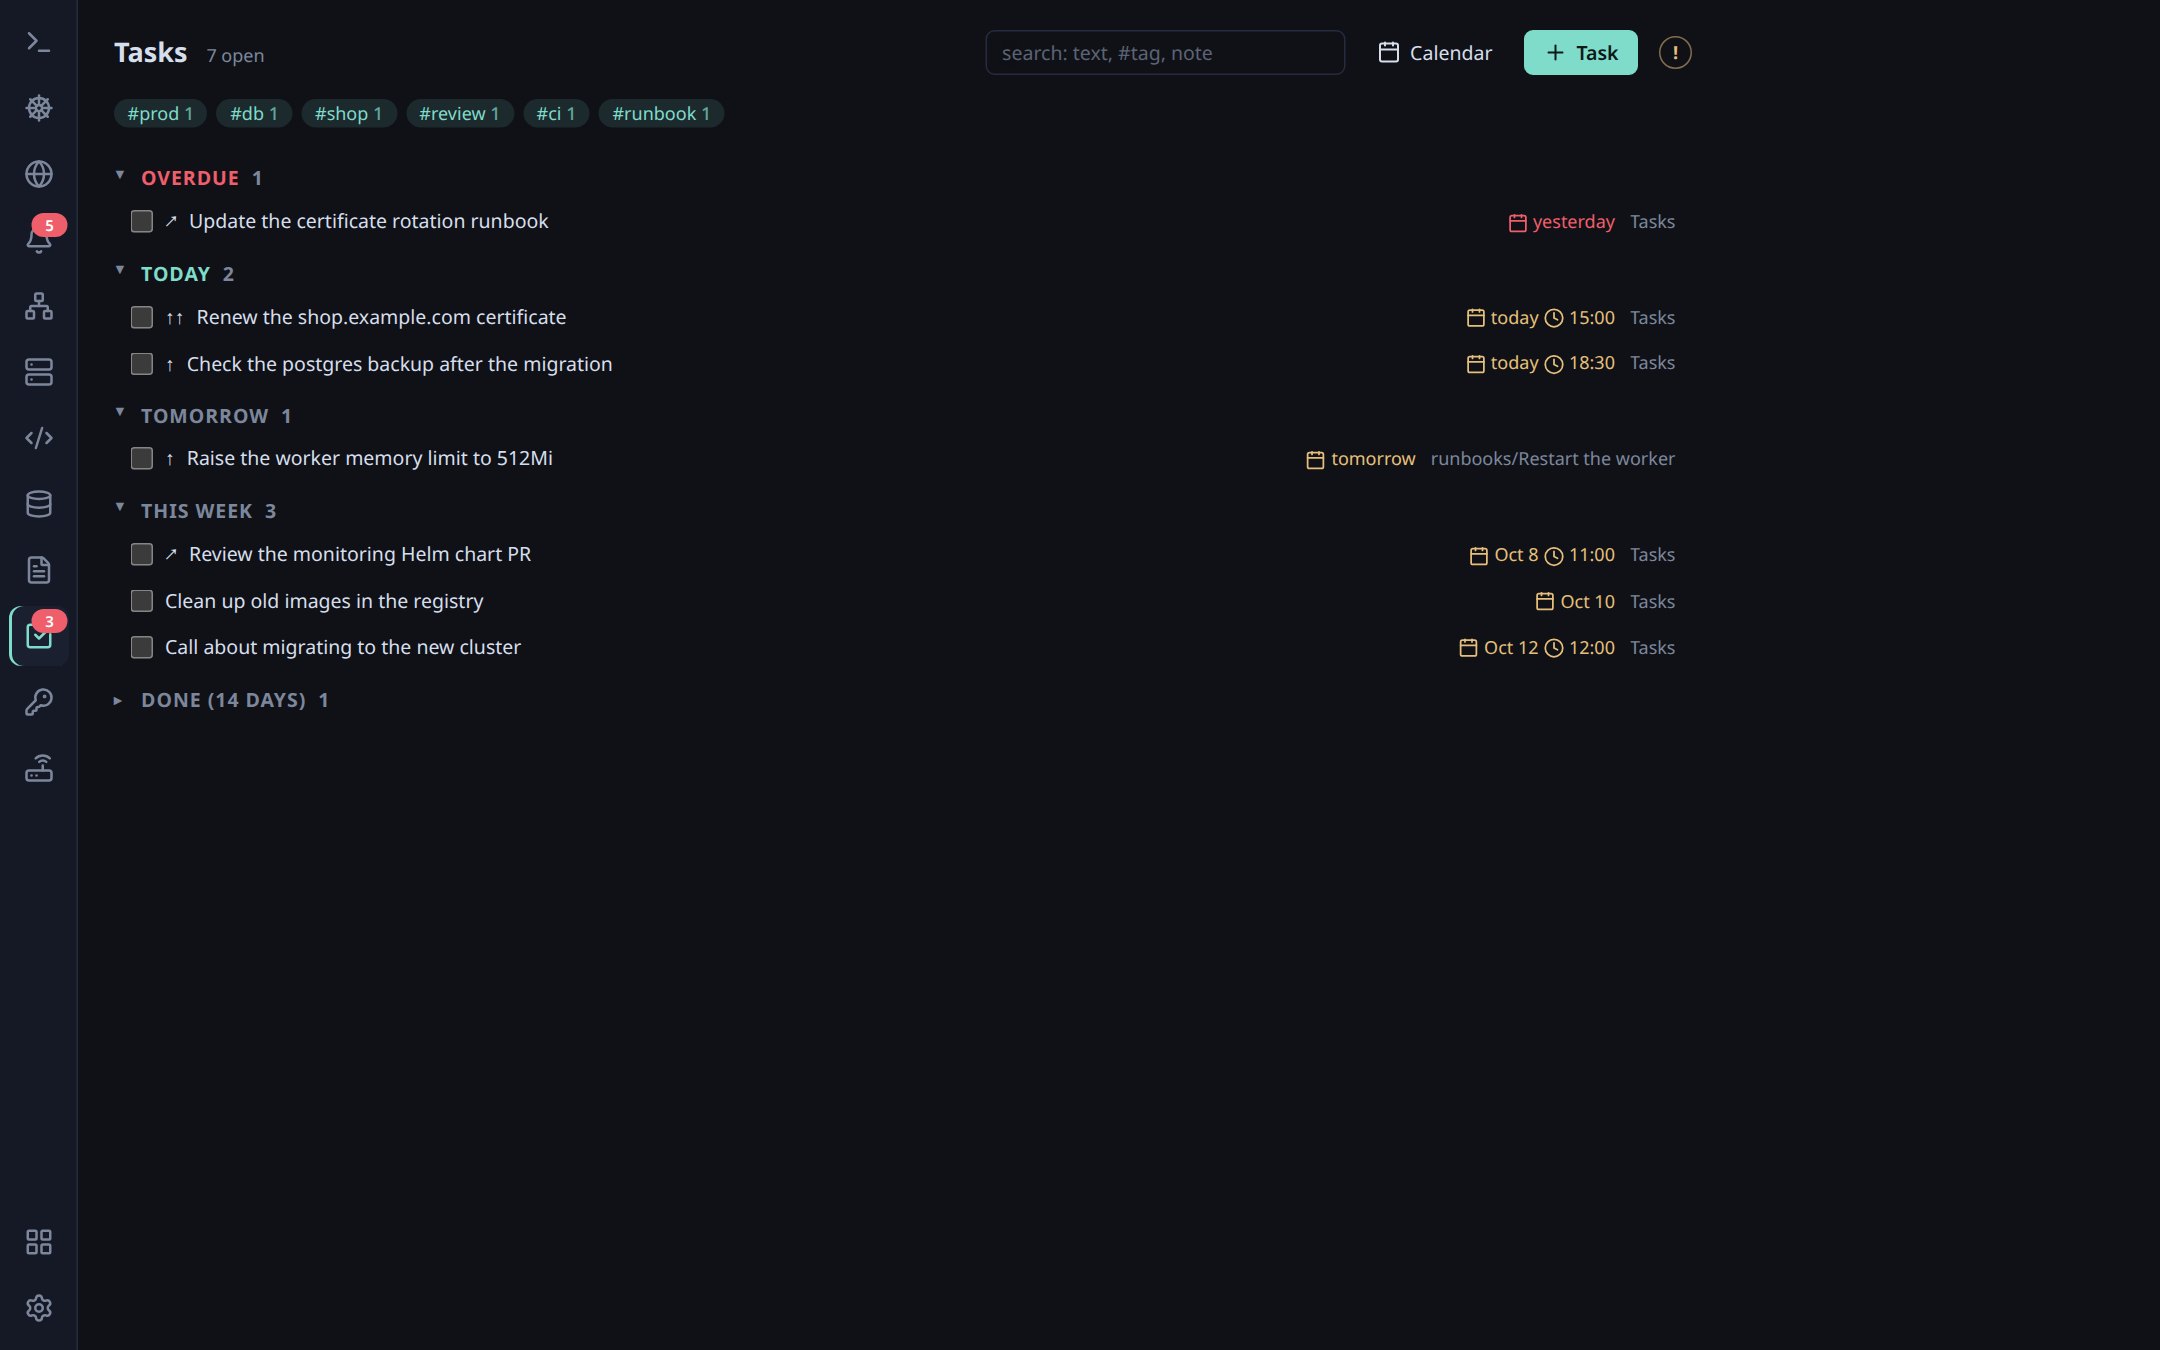
  • All tasks from your notes by due date: overdue, today, tomorrow, this week. A checkbox marks a task done.
  • At the set time a notification pops up: “Done”, “Snooze”, “Open note”. Every morning — a summary of the day.
  • 📅 Calendar — tasks for each day of the month.
How to turn on: the “Tasks & reminders” module in ⊞. Reminders work while OpsDeck is running.
Tasks by due date

KeePass

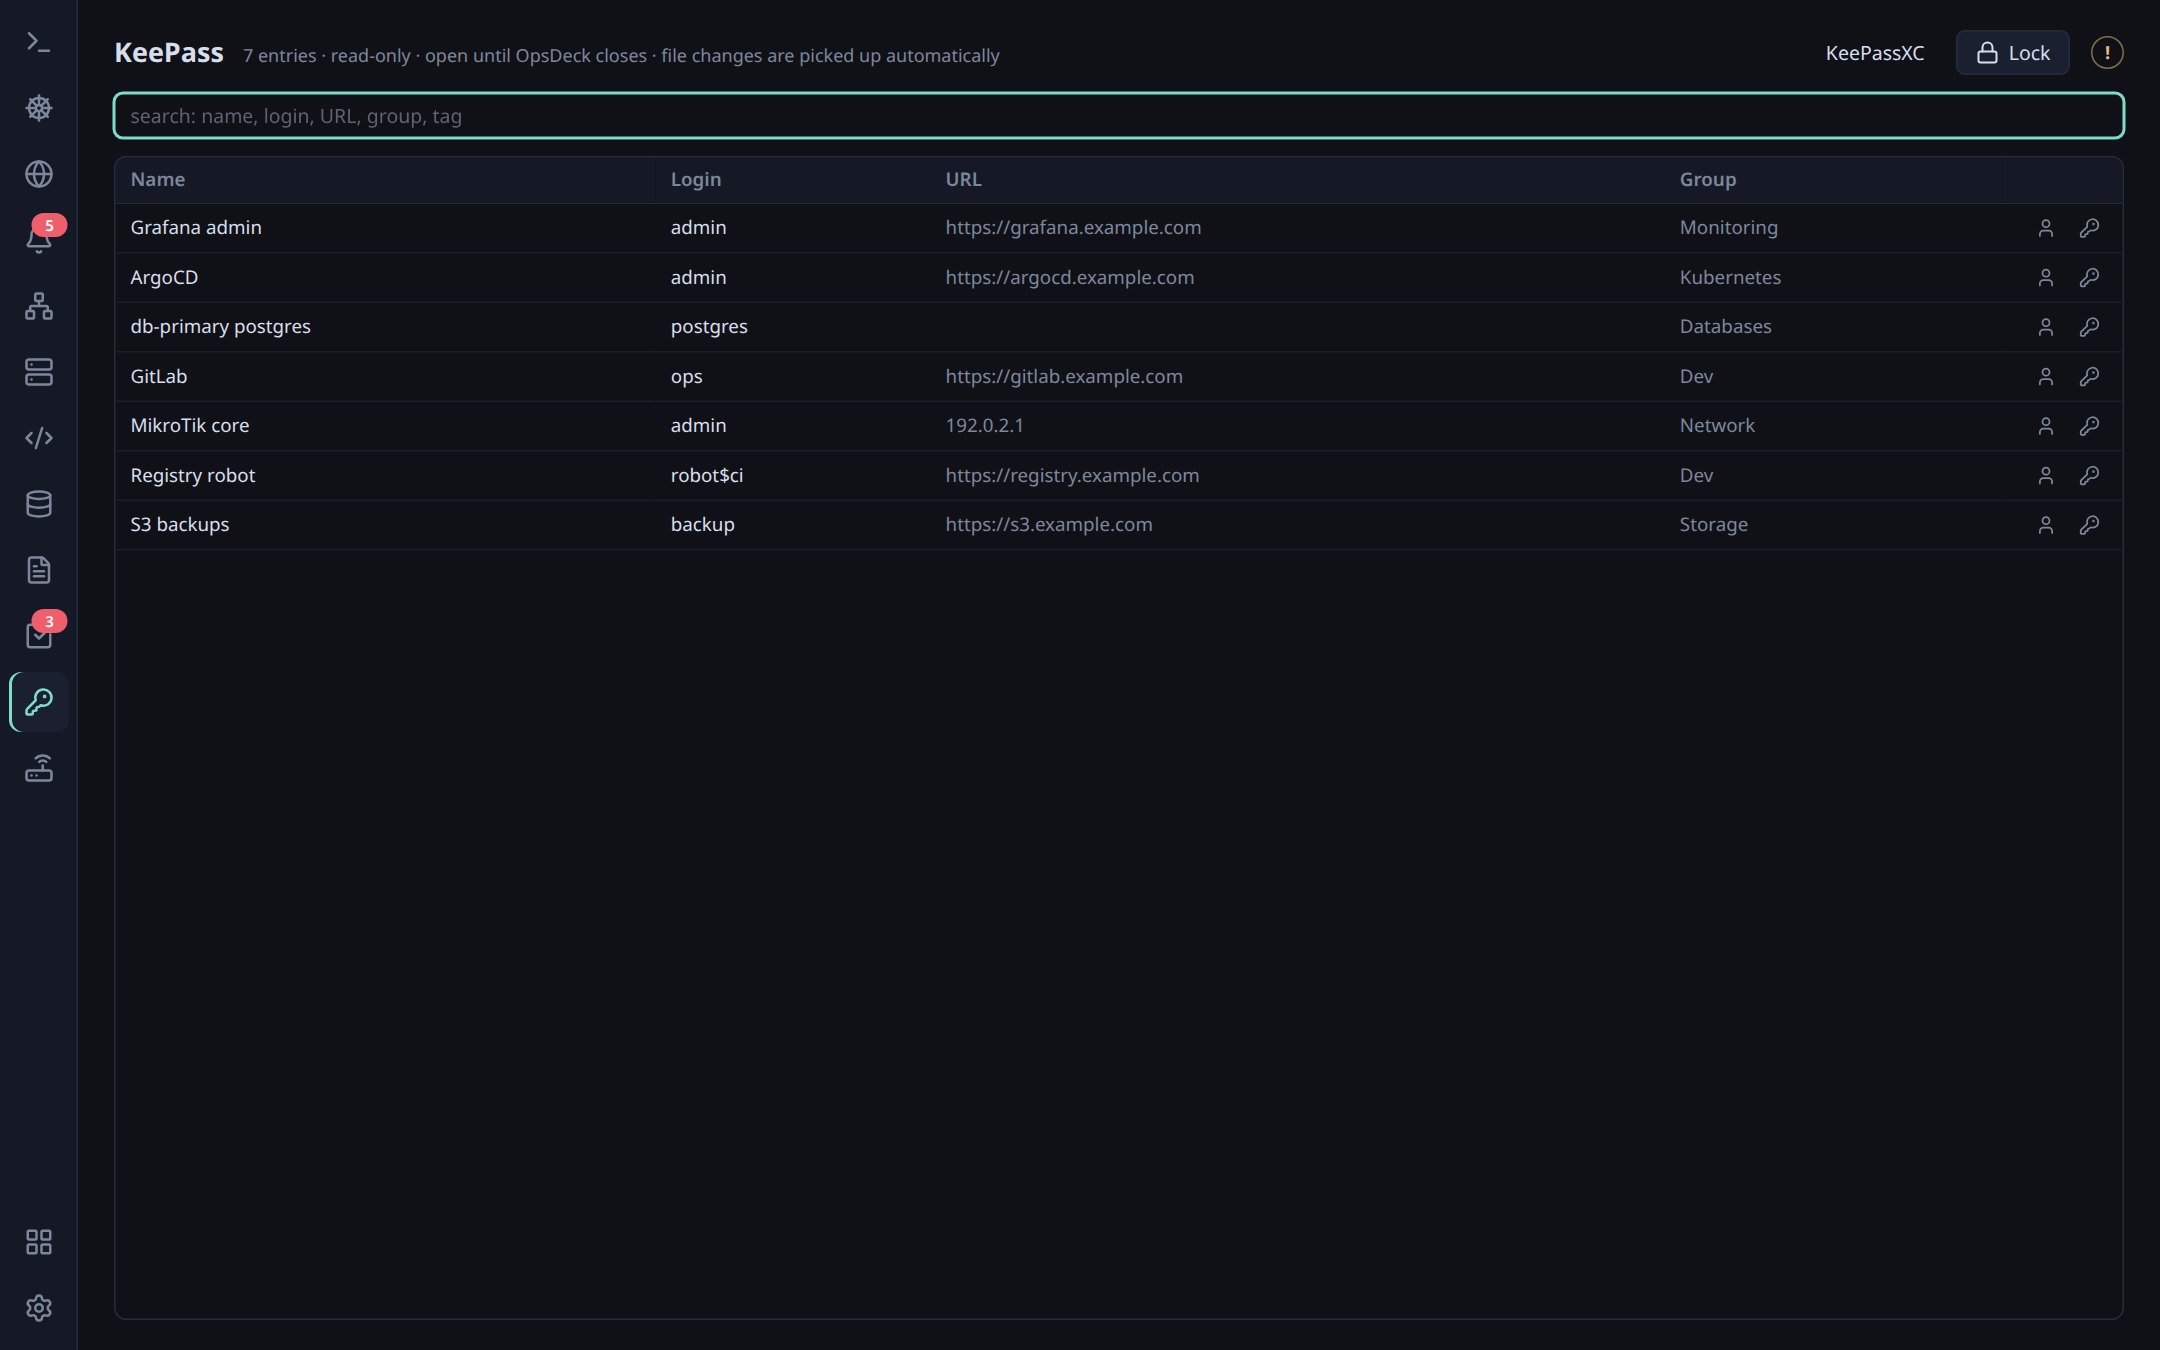
  • The .kdbx database is opened read-only; decrypted, it lives only in memory.
  • Enter the password once — the database stays open until OpsDeck closes and picks up changes made in KeePassXC by itself.
  • 👤 / 🔑 copy the login / password; the clipboard is cleared after 30 seconds.
  • Entries can be linked to web panels, SSH hosts, databases and routers — passwords are filled in automatically.
Settings: ⚙ → KeePass — database path, key file and auto-lock instead of “keep open”.
KeePass entries

Grafana · ArgoCD · GitLab

Web UIs open as tabs right in the window, with the login and password filled in from the keyring or KeePass. Zoom adapts to the screen width. + Add → type, URL, sign-in method.

Network & DNS · MikroTik

ping, mtr, traceroute, dig, nslookup and a port scan with service banners. For MikroTik — WinBox and SSH in one click with the password from KeePass; the WinBox path is in ⚙. “Import from WinBox” brings over the routers saved in its address list, with groups and (if ticked) passwords.

Keyboard shortcuts

All Ctrl+Shift shortcuts work on any keyboard layout.

Ctrl+Shift+PCommand palette: search clusters, hosts, notes, passwords, snippets and history
Ctrl+Shift+KLocal AI: a command from a description in words
Ctrl+Shift+T / Ctrl+Shift+WNew tab / close pane or tab
Alt+1…9, Alt+←/→, Ctrl+TabTab by number (9 — the last one) / previous and next tab
Ctrl+Shift+D / Ctrl+Shift+ESplit the terminal right / down
Ctrl+Shift+↑/↓Previous / next command in the output
Ctrl+Shift+A / Ctrl+Shift+ISelection to AI / show the AI panel
Ctrl+Shift+RReconnect: a dropped SSH session in a tab or a failed ssh in a shell
Ctrl+Shift+BFiles panel of the current folder
Ctrl+= / Ctrl+- / Ctrl+0Terminal font size
→ / Ctrl+→Accept the whole suggestion / one word
Ctrl+S, Ctrl+ESave; in notes — switch editor and preview
Ctrl+EnterRun a database query; in git — commit

FAQ

Is it free? Where does my data go?

It is free, the code is open under the MIT license. Settings live in ~/.config/opsdeck/, passwords in the system password store (keyring), and the KeePass database is opened read-only. The built-in AI runs on your computer. Data leaves it only if you connect an external AI server yourself (OpsDeck warns you) or run a cloud tool such as Claude Code in the AI panel.

Which systems does it run on?

Linux with glibc 2.35+ (Ubuntu 22.04+, Debian 12+, Fedora 36+), Windows 10/11, macOS 10.13+ on Intel and 11+ on Apple Silicon.

How do updates work? What if a new version breaks?

OpsDeck checks GitHub Releases itself: ⚙ shows ↑, and “Update and restart” downloads the update and verifies its signature. If a new version gets in the way, go back to any previous one in ⚙ → Updates → “Other versions”.

macOS says the app is damaged

It isn't — that's how macOS marks downloaded apps without a paid Apple signature. Drag OpsDeck to Applications and run xattr -cr /Applications/OpsDeck.app. If you then see “cannot verify the developer” — System Settings → Privacy & Security → “Open Anyway”.

How do I move OpsDeck to another computer?

⚙ → “Moving to another computer” → “Export…”: tick what to take — settings and interface, SSH, web panels, databases, MikroTik, snippets, kubeconfig, the notes folder. On the new computer — “Import…” with that archive. Passwords are not in the archive (they live in the OS keyring); enter them again.

The local AI is slow

Big models take a few seconds on the CPU. Turn on ⚙ → Local AI → Acceleration → “GPU (Vulkan)” or pick a smaller model. Integrated Intel or AMD graphics work too.

How can I suggest an idea or contribute?

Open an issue. Pull requests go to the dev branch — see CONTRIBUTING.md.